Mathematics, 02.02.2021 19:10 lmimms02
Analyzing Bivariate Data
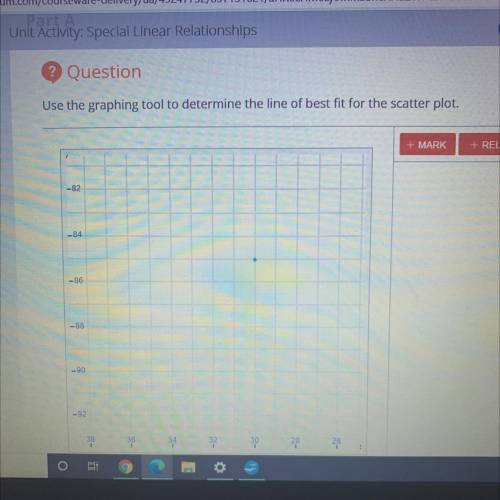
In this activity, you will draw a scatter plot and the line of best fit to analyze a situation.
Jeremy is on the planning committee for the rock climbing club. He is putting together a trip where members
can go outdoor rock climbing. He is trying to determine how high the group should climb and how long the
trip should last. He calls multiple parks in the area that offer rock climbing and collects data on the height of
the rock formations and the average time it takes people to reach the top and come back down. The data he
found is shown.
Time to Climb (min)
30
Height (ft)
85
45
120
115
298
87
194
160
434
60
241
135
351
117
339
55
180
145
400
95
24R


Answers: 1
Another question on Mathematics

Mathematics, 21.06.2019 18:00
Jack has a piece of red ribbon that is two times as long as his piece of blue ribbon. he says that he can use two different equation to find out how long his piece of red ribbon is compared to his piece of blue ribbon is. is he correct? explain his reasoning
Answers: 1

Mathematics, 21.06.2019 18:30
Over the last 8 nights, elyse earned the following in tips: {105, 120, 84, 95, 100, 132, 140}. if she earns $140 a night for the next four nights, which measure of center would increase more, the mean or median?
Answers: 3

Mathematics, 21.06.2019 20:30
Select all the expressions that will include a remainder.
Answers: 1

Mathematics, 21.06.2019 22:30
Factor the polynomial, if possible. if the polynomial cannot be factored, write prime. 9n^3 + 27n^2 – 25n – 75
Answers: 2
You know the right answer?
Analyzing Bivariate Data
In this activity, you will draw a scatter plot and the line of best fit to...
Questions


History, 25.09.2020 23:01

Computers and Technology, 25.09.2020 23:01


English, 25.09.2020 23:01

Mathematics, 25.09.2020 23:01

Mathematics, 25.09.2020 23:01

Mathematics, 25.09.2020 23:01


Mathematics, 25.09.2020 23:01


