
Mathematics, 02.02.2021 23:00 chriscook9965
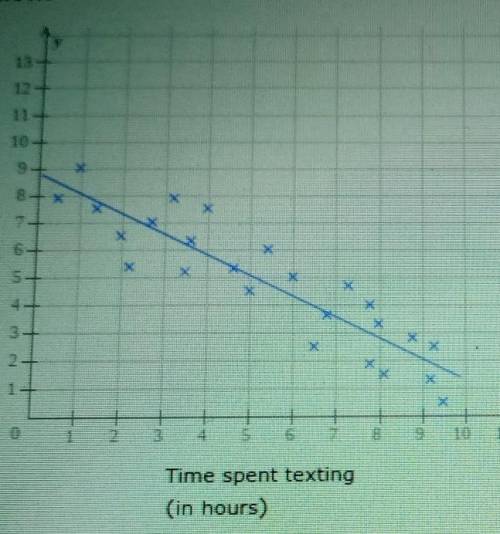
The scatter plot shows the time spent texting and the time spent exercising by 25 students last week also showed us the line of best fit for the data.
for these 25 students at the time spent texting and increases the time spent exercising tends to ?
for these 25 students there is what correlation between the time spent texting and the time spent exercising?
using the line of best fit we were predict that a student texting for 6 hours with exercise approximately how many hours?

Answers: 2
Another question on Mathematics
Mathematics, 21.06.2019 18:30
The base of a triangle is 8 1 3 meters and the height of the triangle is the fourth root of 16 meters meters. what is the area of the triangle?
Answers: 3
Mathematics, 21.06.2019 19:00
What is the simplified form of (3.25x10^3)(7.8x10^6) written in scientific notation?
Answers: 1
Mathematics, 21.06.2019 20:30
The function v(r)=4/3pir^3 can be used to find the volume of air inside a basketball given its radius. what does v(r) represent
Answers: 1
You know the right answer?
The scatter plot shows the time spent texting and the time spent exercising by 25 students last week...
Questions

Mathematics, 24.09.2021 04:40


Biology, 24.09.2021 04:40

French, 24.09.2021 04:40
Mathematics, 24.09.2021 04:50
Mathematics, 24.09.2021 04:50
Mathematics, 24.09.2021 04:50
Mathematics, 24.09.2021 04:50

Chemistry, 24.09.2021 04:50


