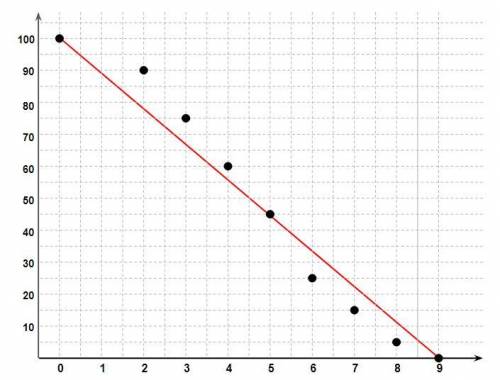
Which associations best describe the scatter plot?
Select each correct answer.
Positive...

Mathematics, 08.02.2021 22:10 rilee3344
Which associations best describe the scatter plot?
Select each correct answer.
Positive association
Linear association
Negative association
Nonlinear association
Scatter plot on a first quadrant coordinate grid. The horizontal axis is labeled Time, in years. The vertical axis is labeled Number infected. Points are plotted at (one, one hundred), (two, ninety), (three, seventy-five), (four, sixty), (five, forty-five), (six, twenty-five), (seven, fifteen), (eight, five), (nine, zero).

Answers: 2
Another question on Mathematics
Mathematics, 21.06.2019 15:30
Complete the statements about the system of linear equation respresented by the tables the equation respented the left table is
Answers: 2
Mathematics, 21.06.2019 18:00
The sat and act tests use very different grading scales. the sat math scores follow a normal distribution with mean 518 and standard deviation of 118. the act math scores follow a normal distribution with mean 20.7 and standard deviation of 5. suppose regan scores a 754 on the math portion of the sat. how much would her sister veronica need to score on the math portion of the act to meet or beat regan's score?
Answers: 1
Mathematics, 21.06.2019 19:30
1. are the corresponding angles congruent 2. find the ratios of the corresponding sides 3. is triangle jkl congruent to triangle rst? if so what is the scale factor
Answers: 1
You know the right answer?
Questions

English, 11.05.2021 23:40


Mathematics, 11.05.2021 23:40
English, 11.05.2021 23:40
Mathematics, 11.05.2021 23:40

Mathematics, 11.05.2021 23:40

Mathematics, 11.05.2021 23:40
English, 11.05.2021 23:40


