
Mathematics, 09.02.2021 01:30 kah36
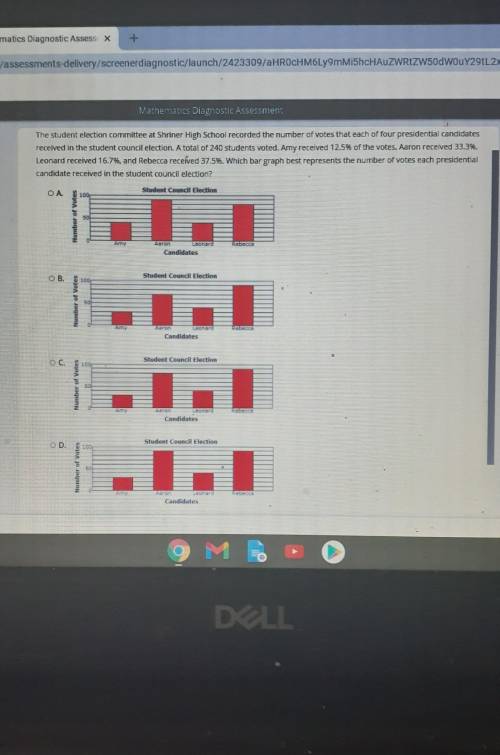
The student election committee at Shriner High School recorded the number of votes that each of four presidential candidates received in the student council election. A total of 240 students voted. Amy received 12.5% of the votes, Aaron received 33.3%, Leonard received 16.7%, and Rebecca received 37.5%. Which bar graph best represents the number of votes each presidential Candidate received in the student council election? studantillan

Answers: 3
Another question on Mathematics
Mathematics, 21.06.2019 17:20
Researchers were interested in whether relaxation training decreases the number of headaches a person experiences. they randomly assigned 20 participants to a control group or a relaxation training group and noted the change in number of headaches each group reported from the week before training to the week after training. which statistical analysis should be performed to answer the researchers' question?
Answers: 2
Mathematics, 21.06.2019 17:30
Which are factor pairs of 350? choose all answers that are correct. a) 30 and 12 b) 35 and 10 c) 70 and 5 d) 2 and 125
Answers: 2
Mathematics, 21.06.2019 22:40
Which of the following functions corresponds to the above sinusoid? a. 10 cos πx - 5 b. -5 sin x - 5 c. -10 cos πx/2 - 0.5 d. 10 sin πx - 5
Answers: 1
You know the right answer?
The student election committee at Shriner High School recorded the number of votes that each of four...
Questions
Mathematics, 05.12.2020 22:30

Arts, 05.12.2020 22:30

Biology, 05.12.2020 22:30

English, 05.12.2020 22:30
English, 05.12.2020 22:30

Chemistry, 05.12.2020 22:30
Mathematics, 05.12.2020 22:30
Mathematics, 05.12.2020 22:30
English, 05.12.2020 22:30
Biology, 05.12.2020 22:30
Biology, 05.12.2020 22:30
Mathematics, 05.12.2020 22:30
Mathematics, 05.12.2020 22:30
Biology, 05.12.2020 22:30


