subject
Mathematics, 09.02.2021 19:40 lalandaid

Did I pick the right one ? 1)
W
80
60
Weight (in kg)
40
20
110
120 130 140 150 160
Height (in cm)
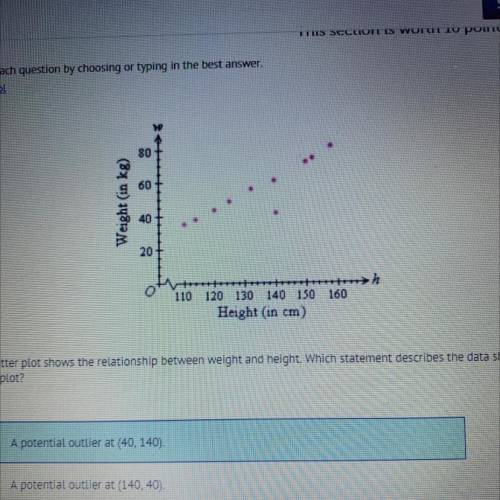
The scatter plot shows the relationship between weight and height. Which statement describes the data shown in the
scatter plot?
A)
A potential outlier at (40, 140).
B)
A potential outlier at 140,40).
A cluster between weight of 35 kg to 80 kg.
D)
A cluster between height of 110 cm to 160 cm.


Did I pick the right one ?

1)
W
80
60
Weight (in kg)
40
20
110
120 130 140 150 160
Height (in cm)

ansver
Answers: 1

Another question on Mathematics

question
Mathematics, 21.06.2019 13:10
What is the greatest common factor of 8 and 36
Answers: 2
question
Mathematics, 21.06.2019 15:30
On the first of each month, shelly runs a 5k race. she keeps track of her times to track her progress. her time in minutes is recorded in the table: jan 40.55 july 35.38 feb 41.51 aug 37.48 mar 42.01 sept 40.87 apr 38.76 oct 48.32 may 36.32 nov 41.59 june 34.28 dec 42.71 determine the difference between the mean of the data, including the outlier and excluding the outlier. round to the hundredths place. 39.98 39.22 0.76 1.21
Answers: 1
question
Mathematics, 21.06.2019 21:00
Rewrite the following quadratic functions in intercept or factored form. show your work. y = 9 + 12x + 4x^2
Answers: 2
question
Mathematics, 22.06.2019 00:00
Yvaries inversely as x. y =12 when x=5. find y when x=4
Answers: 2
You know the right answer?
Did I pick the right one ? 1)
W
80
60
Weight (in kg)
40
20
Questions
question
Mathematics, 12.04.2021 23:20
question
Mathematics, 12.04.2021 23:20
question
Mathematics, 12.04.2021 23:20
Questions on the website: 13722362