E
OV
<
Question 12/12
BOOKMARK
SUBMIT
The data given below shows t...

Mathematics, 09.02.2021 21:20 victory08
E
OV
<
Question 12/12
BOOKMARK
SUBMIT
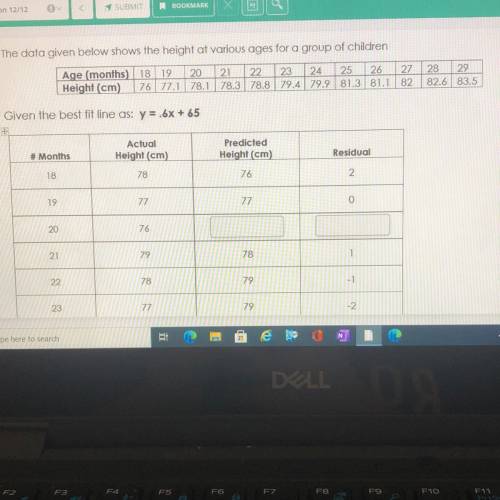
The data given below shows the height at various ages for a group of children
Age (months) 18 19 20 21 22 23 24 25 26 27 28 29
Height (cm) 76 77.1 78.1 78.3 78.8 79.4 79.9 81.3 81.1 82 82.6 83.5
Given the best fit line as: y = .6x + 65
Predicted
Height (cm)
Residual
Actual
Height (cm)
78
# Months
18
76
2
19
77
77
0
20
76
21
79
78
1
22
78
79
-1
23
77
79
-2
e

Answers: 2
Another question on Mathematics
Mathematics, 21.06.2019 17:00
Benito is selecting samples of five values from the table, which row will result in the greatest mean? population data row 1 4 2 2 3 3 row 2 3 3 4 3 2 row 3 2 4 3 4 3 row 4 3 4 4 7 3 row 1 row 2 r
Answers: 3
Mathematics, 21.06.2019 17:40
If sec theta = 5/3 and the terminal point determined by theta is in quadrant 4, then
Answers: 1
Mathematics, 21.06.2019 18:40
Which expression gives you the distance between the points (5,1)and(9,-6)
Answers: 2
Mathematics, 21.06.2019 20:00
Find all solutions for 2y - 4x =2 y = 2x + 1 site: socratic.org
Answers: 1
You know the right answer?
Questions
Mathematics, 04.09.2021 23:50
Mathematics, 04.09.2021 23:50


Social Studies, 05.09.2021 01:00
Mathematics, 05.09.2021 01:00

Mathematics, 05.09.2021 01:00
Mathematics, 05.09.2021 01:00

Biology, 05.09.2021 01:00
Mathematics, 05.09.2021 01:00

Biology, 05.09.2021 01:00
Mathematics, 05.09.2021 01:00

Advanced Placement (AP), 05.09.2021 01:00
Mathematics, 05.09.2021 01:00
Mathematics, 05.09.2021 01:00

Health, 05.09.2021 01:00


