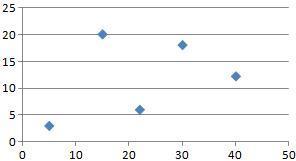
Find the rate of change of the function by using two points from the table.
x y
1 15
2...

Mathematics, 09.02.2021 21:30 vipergod07
Find the rate of change of the function by using two points from the table.
x y
1 15
2 11
3 7
4 3

Answers: 1
Another question on Mathematics


Mathematics, 21.06.2019 14:30
Write the system of equations represented by the matrix. 0 1 2 4 -2 3 6 9 1 0 1 3
Answers: 2

Mathematics, 21.06.2019 19:00
Graph g(x)=2cosx . use 3.14 for π . use the sine tool to graph the function. graph the function by plotting two points. the first point must be on the midline and closest to the origin. the second point must be a maximum or minimum value on the graph closest to the first point.
Answers: 1

Mathematics, 21.06.2019 20:00
Ialready asked this but i never got an answer. will give a high rating and perhaps brainliest. choose the linear inequality that describes the graph. the gray area represents the shaded region. y ≤ –4x – 2 y > –4x – 2 y ≥ –4x – 2 y < 4x – 2
Answers: 1
You know the right answer?
Questions

Physics, 02.07.2019 06:30

Mathematics, 02.07.2019 06:30

Mathematics, 02.07.2019 06:30


Mathematics, 02.07.2019 06:30

History, 02.07.2019 06:30


Biology, 02.07.2019 06:30

Biology, 02.07.2019 06:30


Mathematics, 02.07.2019 06:30

Mathematics, 02.07.2019 06:30

Geography, 02.07.2019 06:30

Arts, 02.07.2019 06:30

Geography, 02.07.2019 06:30


