
Mathematics, 15.02.2021 20:30 d1Dej
Bone strength, gives the bone strengths of the dominant and the nondominant arms for 15 men who were controls in a study.
ID Group NonDom Dom
1 Control 15.7 16.3
2 Control 25.2 26.9
3 Control 17.9 18.7
4 Control 19.1 22.0
5 Control 12.0 14.8
6 Control 20.0 19.8
7 Control 12.3 13.1
8 Control 14.4 17.5
9 Control 15.9 20.1
10 Control 13.7 18.7
11 Control 17.7 18.7
12 Control 15.5 15.2
13 Control 14.4 16.2
14 Control 14.1 15.0
15 Control 12.3 12.9
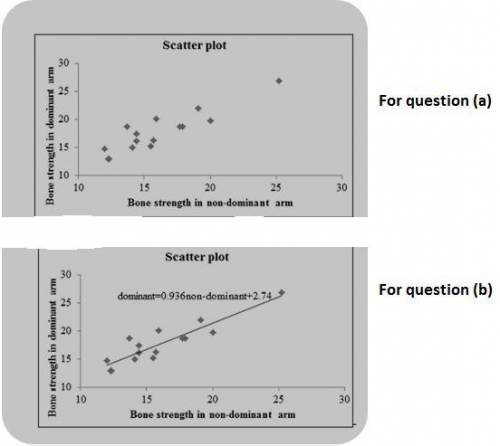
a. Plot the data. Use the bone strength in the nondominant arm as the explanatory variable and bone strength in the dominant arm as the response variable.
b. The least-squares regression line for these data is dominant = 2.74 + (0.936 × nondominant) Add this line to your plot.
c. Use the scatterplot (a graphical summary), with the least-squares line (a graphical display of a numerical summary) to write a short paragraph describing this relationship.

Answers: 1
Another question on Mathematics
Mathematics, 21.06.2019 14:30
The expression 6x2 gives the surface area of a cube, and the expression x3 gives the volume of a cube, where x is the length of one side of the cube. find the surface area and the volume of a cube with a side length of 6m
Answers: 3
Mathematics, 21.06.2019 23:00
Of the 304 people who attended a school play, 5/8 were students. how many of the people who attended were students.
Answers: 1
Mathematics, 22.06.2019 01:30
If two lines form congruent alternate interior angles with a transversal, then the lines
Answers: 2
You know the right answer?
Bone strength, gives the bone strengths of the dominant and the nondominant arms for 15 men who were...
Questions

Biology, 13.01.2021 07:40

English, 13.01.2021 07:40

History, 13.01.2021 07:40

Social Studies, 13.01.2021 07:40
History, 13.01.2021 07:40
Biology, 13.01.2021 07:40
Social Studies, 13.01.2021 07:40

English, 13.01.2021 07:40

History, 13.01.2021 07:40
History, 13.01.2021 07:40

English, 13.01.2021 07:40


