
Mathematics, 22.02.2021 22:30 meaghan18
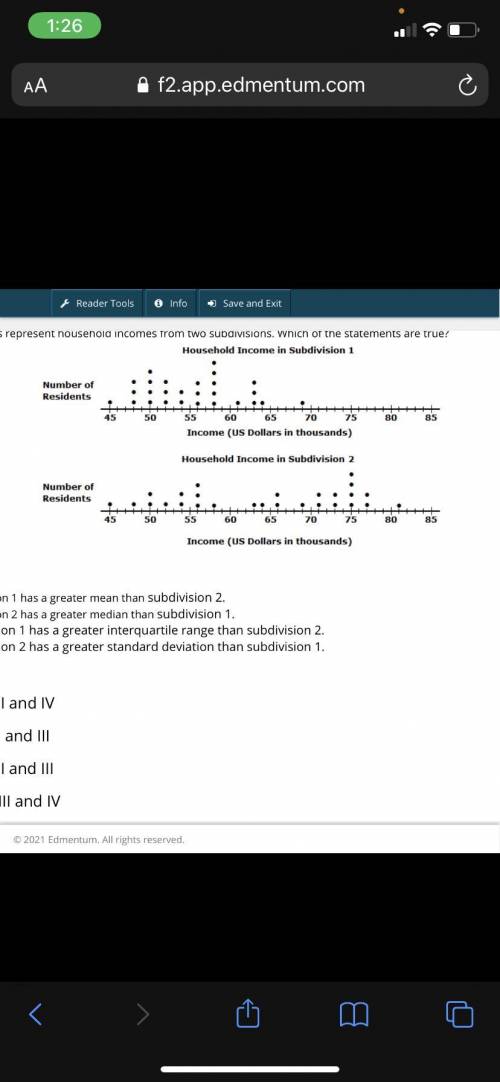
The dot plots represent household incomes from two subdivisions. Which of the statements are true? I. Subdivision 1 has a greater mean than subdivision 2. II. Subdivision 2 has a greater median than subdivision 1. III. Subdivision 1 has a greater interquartile range than subdivision 2. IV. Subdivision 2 has a greater standard deviation than subdivision 1. A. II and IV B. I and III C. II and III D. III and IV

Answers: 3
Another question on Mathematics
Mathematics, 20.06.2019 18:04
The triangles are similar. what is the value of x? enter your answer in the box. x = two right triangles. the larger right triangle is labeled x on the longer leg, 12 on the shorter leg and 20 on the hypotenuse. the smaller triangle is labeled 4 on the longer leg, 3 on the shorter leg, and 5 on the hypotenuse.
Answers: 2
Mathematics, 21.06.2019 16:00
Enter the number of complex zeros for the polynomial function f(x) = x 4+ 5x² +6
Answers: 2
Mathematics, 21.06.2019 16:30
If g(x) is an odd function, which function must be an even function?
Answers: 3
You know the right answer?
The dot plots represent household incomes from two subdivisions. Which of the statements are true? I...
Questions

Physics, 23.09.2019 04:30

Business, 23.09.2019 04:30

English, 23.09.2019 04:30
Physics, 23.09.2019 04:30


Computers and Technology, 23.09.2019 04:30
Mathematics, 23.09.2019 04:30

Biology, 23.09.2019 04:30
Mathematics, 23.09.2019 04:30
Physics, 23.09.2019 04:30
English, 23.09.2019 04:30


