
Mathematics, 23.02.2021 04:10 daniecott
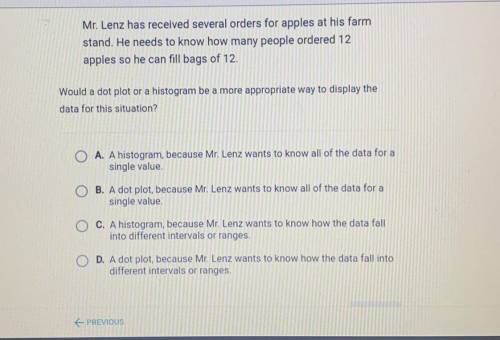
Mr. Lenz has received several orders for apples at his farm
stand. He needs to know how many people ordered 12
apples so he can fill bags of 12.
Would a dot plot or a histogram be a more appropriate way to display the
data for this situation?
A. A histogram, because Mr. Lenz wants to know all of the data for a
single value
O B. A dot plot, because Mr. Lenz wants to know all of the data for a
single value.
C. A histogram, because Mr. Lenz wants to know how the data fall
into different intervals or ranges.
D. A dot plot, because Mr. Lenz wants to know how the data fall into
different intervals or ranges.

Answers: 1
Another question on Mathematics
Mathematics, 21.06.2019 17:00
Evaluate the expression for the given value of the variable 7a - 4a for a =8
Answers: 2
You know the right answer?
Mr. Lenz has received several orders for apples at his farm
stand. He needs to know how many people...
Questions
Mathematics, 10.03.2021 20:00

Advanced Placement (AP), 10.03.2021 20:00


History, 10.03.2021 20:00

Social Studies, 10.03.2021 20:00
History, 10.03.2021 20:10
Mathematics, 10.03.2021 20:10

Physics, 10.03.2021 20:10

Geography, 10.03.2021 20:10

Mathematics, 10.03.2021 20:10
Mathematics, 10.03.2021 20:10
Mathematics, 10.03.2021 20:10


