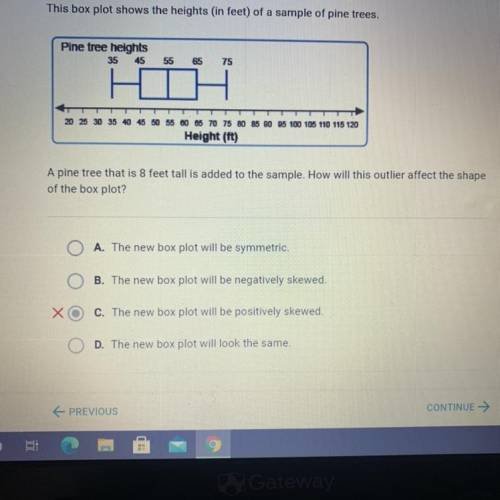
This box plot shows the heights (in feet) of a sample of pine trees.
Pine tree heights
35 45<...

Mathematics, 24.02.2021 20:10 ibarral37102
This box plot shows the heights (in feet) of a sample of pine trees.
Pine tree heights
35 45
55
65
75
20 25 30 35 40 45 50 55 60 65 70 75 80 85 90 95 100 105 110 115 120
Height (ft)
A pine tree that is 8 feet tall is added to the sample. How will this outlier affect the sha
of the box plot?

Answers: 1
Another question on Mathematics
Mathematics, 21.06.2019 18:00
Write an equation for the function that includes the points (1,4/5) and (2,2/3)
Answers: 1
Mathematics, 21.06.2019 19:30
Suzanne began a trip with 18 1/2 gallons of gas in the gas tank of her car if she hughes 17 3/4 gallons on the trip how many gallons does she have left once she finish the trip
Answers: 1
Mathematics, 21.06.2019 20:10
60 2(x + 2) in the diagram, gef and hef are congruent. what is the value of x?
Answers: 2
You know the right answer?
Questions

Engineering, 16.04.2020 23:51


English, 16.04.2020 23:51

Mathematics, 16.04.2020 23:51


History, 16.04.2020 23:51
English, 16.04.2020 23:51


