
Mathematics, 03.03.2021 14:00 gracye
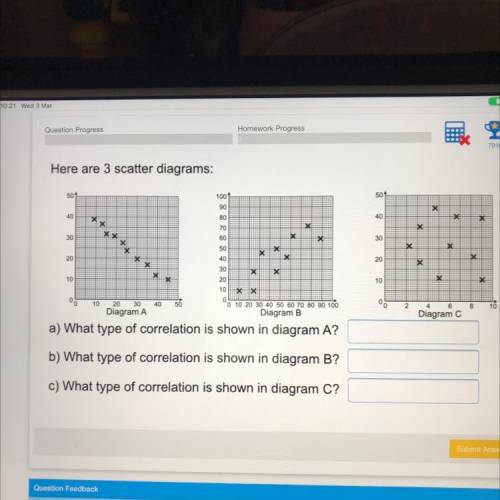
A) What type of correlation is shown in diagram A?
b) What type of correlation is shown in diagram B?
c) What type of correlation is shown in diagram C?

Answers: 2
Another question on Mathematics
Mathematics, 21.06.2019 21:40
Which of the following best describes the graph below? + + 2 + 3 + 4 1 o a. it is not a function. o b. it is a one-to-one function. o c. it is a many-to-one function. o d. it is a function, but it is not one-to-one.
Answers: 3
Mathematics, 22.06.2019 03:00
Will give the box plots below show the math scores of students in two different classes: class a 55 72 75 89 95 class b 55 70 75 94 100 based on the box plots, which statement is correct? a: the median score of class a is greater than the median score of class b. b: the lower quartile of class a is greater than the lower quartile of class b. c: the upper quartile of class a is greater than the upper quartile of class b. d: the maximum score of class a is greater than the maximum score of class b.
Answers: 1
Mathematics, 22.06.2019 04:00
Acontainer full of water weighs 15.5 lbs. when ¼ of the water is poured out, the container now weighs 12 ½ lbs. how much does the container weigh when empty?
Answers: 1
Mathematics, 22.06.2019 05:00
Write ratios for the amount of oats to the amount of each of the other grains?
Answers: 3
You know the right answer?
A) What type of correlation is shown in diagram A?
b) What type of correlation is shown in diagram...
Questions


Business, 30.07.2019 19:50
Social Studies, 30.07.2019 19:50

Mathematics, 30.07.2019 19:50
Mathematics, 30.07.2019 19:50
Social Studies, 30.07.2019 19:50
Social Studies, 30.07.2019 19:50


Mathematics, 30.07.2019 19:50


