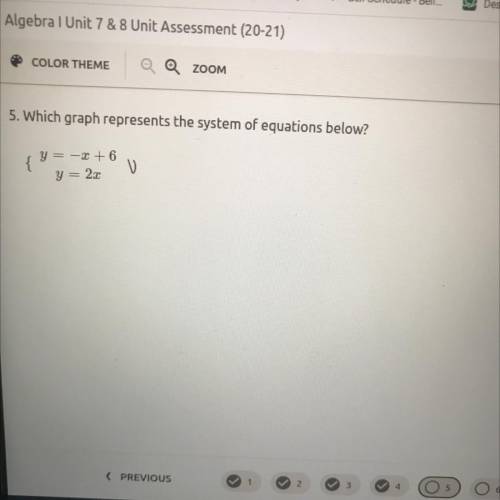
What graph represents the system of equations below
y = - x+6
y = 2x
...

Mathematics, 03.03.2021 22:10 ymuttmutt3890
What graph represents the system of equations below
y = - x+6
y = 2x

Answers: 2
Another question on Mathematics
Mathematics, 21.06.2019 13:10
The rows and columns of lattice points in a three-by-three square array are evenly spaced one unit apart. how many distinct triangles with at least one side of length 2 units can be drawn using three lattice points for the vertices?
Answers: 1
Mathematics, 21.06.2019 22:20
Let f(x) = 5/x and g(x)=2x2+5x. what two numbers are not in the domain of f o g
Answers: 2
Mathematics, 22.06.2019 03:40
Which is the graph of linear inequality 2y > x – 2? image for option 1 image for option 2 image for option 3 image for option 4
Answers: 3
Mathematics, 22.06.2019 04:40
This assignment is past the original due date o this data is from a sample. calculate the mean, standard deviation, and variance 16.7 11.1 46.7 14.8 13.3 16.6 18.5 47.3 42,8 show the following answers to 2 decimal places. sample mean- sample standard deviation ( use the standard deviation above for your calculation.) sample variance ooops- now you discover that the data was actually from a population! so now you must give the population standard deviation.
Answers: 3
You know the right answer?
Questions
Mathematics, 08.06.2021 14:00
Mathematics, 08.06.2021 14:00

Computers and Technology, 08.06.2021 14:00

Mathematics, 08.06.2021 14:00
Mathematics, 08.06.2021 14:00
Mathematics, 08.06.2021 14:00

Mathematics, 08.06.2021 14:00

Social Studies, 08.06.2021 14:00
Mathematics, 08.06.2021 14:00
Mathematics, 08.06.2021 14:00

Health, 08.06.2021 14:00
Mathematics, 08.06.2021 14:00
English, 08.06.2021 14:00
Mathematics, 08.06.2021 14:00


