TRI
MJ Pre-Algebra V16, Kelly Muir ( 4028/ S) -
Question 1 (Essay Worth 10 points)
(06....

Mathematics, 05.03.2021 07:20 twistedhyperboles
TRI
MJ Pre-Algebra V16, Kelly Muir ( 4028/ S) -
Question 1 (Essay Worth 10 points)
(06.01 MC)
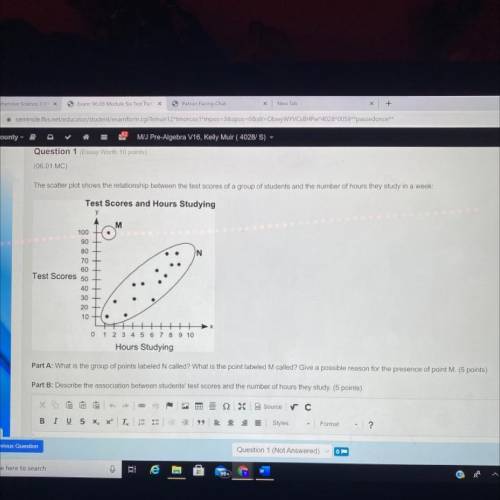
The scatter plot shows the relationship between the test scores of a group of students and the number of hours they study in a week:
Test Scores and Hours Studying
у
M
N
100
90
80
70
60
Test Scores 50
40
30
20
10 H.
0
1 2 3 4 5 6 7 8 9 10
Hours Studying
Part A: What is the group of points labeled N called? What is the point labeled M called? Give a possible reason for the presence of point M. (5 points)
Part B: Describe the association between students' test scores and the number of hours they study. (5 points)

Answers: 1
Another question on Mathematics
Mathematics, 21.06.2019 14:00
If x = 12 and y = 3, what is the value of x - y 2? 81 6 3 18
Answers: 1
Mathematics, 21.06.2019 19:00
Me with geometry ! in this figure, bc is a perpendicular bisects of kj. dm is the angle bisects of bdj. what is the measure of bdm? •60° •90° •30° •45°
Answers: 2
Mathematics, 21.06.2019 22:00
In the sixth grade 13 out of 20 students have a dog if there are 152 sixth grade students how many of them have a dog
Answers: 2
Mathematics, 21.06.2019 23:30
The graph of the the function f(x) is given below. find [tex]\lim_{x \to 0\zero} f(x)[/tex] [tex]\lim_{x \to 1+\oneplus} f(x)[/tex] [tex]\lim_{x \to 0-\zeroneg} f(x)[/tex]
Answers: 1
You know the right answer?
Questions


Advanced Placement (AP), 13.11.2020 17:50

English, 13.11.2020 17:50

Computers and Technology, 13.11.2020 17:50

Social Studies, 13.11.2020 17:50
English, 13.11.2020 17:50

Chemistry, 13.11.2020 17:50
Social Studies, 13.11.2020 17:50
History, 13.11.2020 17:50
Social Studies, 13.11.2020 17:50


