3. a. What trend line, in slope-intercept form, models the data
from the Example 2 Try it?
b....

Mathematics, 05.03.2021 19:40 areeves39276
3. a. What trend line, in slope-intercept form, models the data
from the Example 2 Try it?
b. Explain why there could be no data points on a trend line,
yet the line models the data.
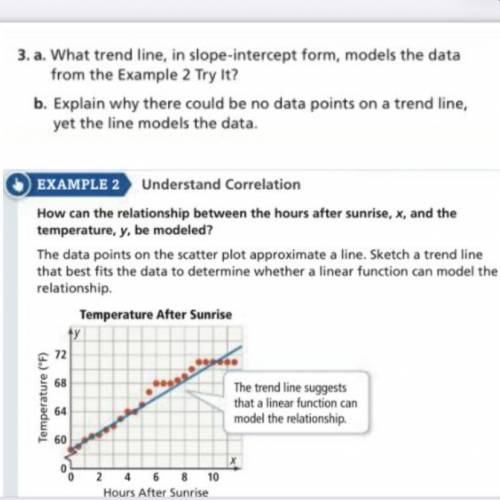
EXAMPLE 2 Understand Correlation
How can the relationship between the hours after sunrise, x, and the
temperature, y. be modeled?
The data points on the scatter plot approximate a line. Sketch a trend line
that best fits the data to determine whether a linear function can model the
relationship
Temperature After Sunrise
dy
72
I
68
Temperature (7)
The trend line suggests
that a linear function can
model the relationship
64
60
2 4 6 8 10
Hours After Sunrise

Answers: 2
Another question on Mathematics
Mathematics, 21.06.2019 17:00
In a sample of 2023 u.s. adults, 373 said franklin roosevelt was the best president since world war ii. two u.s. adults are selected at random from the population of all u.s. adults without replacement. assuming the sample is representative of all u.s. adults, complete parts (a) through (d). (a) find the probability that both adults say franklin roosevelt was the best president since world war ii. the probability that both adults say franklin roosevelt was the best president since world war ii is (round to three decimal places as needed.) (b) find the probability that neither adult says franklin roosevelt was the best president since world war ii. the probability that neither adult says franklin roosevelt was the best president since world war ii is (round to three decimal places as needed.) (c) find the probability that at least one of the two adults says franklin roosevelt was the best president since world war ii. the probability that at least one of the two adults says franklin roosevelt was the best president since world war ii is (round to three decimal places as needed.) (d) which of the events can be considered unusual? explain. select all that apply. the event in part left parenthesis a right parenthesis is unusual because its probability is less than or equal to 0.05. the event in part (b) is unusual because its probability is less than or equal to 0.05. none of these events are unusual. the event in part (c) is unusual because its probability is less than or equal to 0.05.
Answers: 3
Mathematics, 21.06.2019 23:30
Simplify (8x2 − 1 + 2x3) − (7x3 − 3x2 + 1). −5x3 + 11x2 − 2 5x3 − 11x2 + 2 x3 + 2x2 + x3 x3 − 2x2 − x3
Answers: 1
Mathematics, 22.06.2019 00:20
If your score on your next statistics test is converted to a z score, which of these z scores would you prefer: minus2.00, minus1.00, 0, 1.00, 2.00? why? a. the z score of 2.00 is most preferable because it is 2.00 standard deviations above the mean and would correspond to the highest of the five different possible test scores. b. the z score of 0 is most preferable because it corresponds to a test score equal to the mean. c. the z score of minus2.00 is most preferable because it is 2.00 standard deviations below the mean and would correspond to the highest of the five different possible test scores. d. the z score of minus1.00 is most preferable because it is 1.00 standard deviation below the mean and would correspond to an above average
Answers: 2
Mathematics, 22.06.2019 00:30
Use the irregular polygon below. show all work. a. find the perimeter. b. find the area. the angles of the irregular polygon is 2, 8, 8, and 4.
Answers: 2
You know the right answer?
Questions


English, 14.05.2021 15:50
Mathematics, 14.05.2021 15:50

History, 14.05.2021 15:50


Biology, 14.05.2021 15:50
Mathematics, 14.05.2021 15:50
English, 14.05.2021 15:50
Social Studies, 14.05.2021 15:50
Mathematics, 14.05.2021 15:50
History, 14.05.2021 15:50


