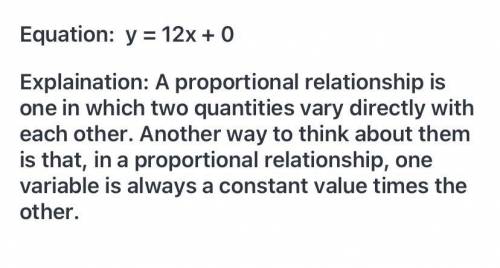
The graph shows a proportional relationship between
the variables x and y.
A. Write an...

Mathematics, 08.03.2021 22:30 naomicervero
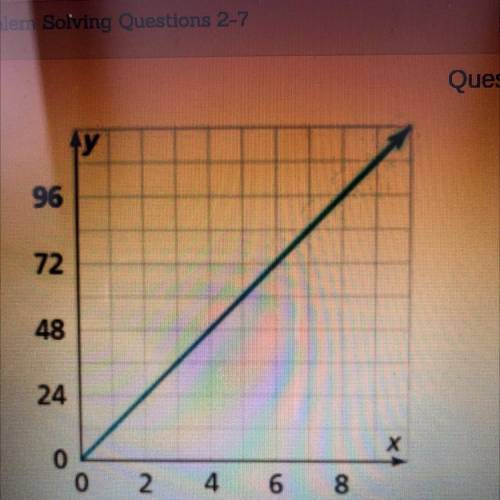
The graph shows a proportional relationship between
the variables x and y.
A. Write an equation to model the relationship
B. Explain how you know if an equation or a graph
represents a proportional relationship.

Answers: 3
Another question on Mathematics
Mathematics, 22.06.2019 00:00
Aclothing designer is selecting models to walk the runway for her fashion show. the clothes she designed require each model’s height to be no more than y inches from 5 feet 10 inches, or 70 inches. which graph could be used to determine the possible variance levels that would result in an acceptable height, x?
Answers: 2
Mathematics, 22.06.2019 05:30
If f(x) = 4 - xand g(x) = 6x, which expression is equivalent to (g-1)(3)? 6-3-(4 + 3)2 6-3-(4-32) 6(3) - 4+32 6(3)-4-32
Answers: 1
You know the right answer?
Questions


Social Studies, 30.03.2020 18:43
Mathematics, 30.03.2020 18:43

Computers and Technology, 30.03.2020 18:43

History, 30.03.2020 18:43


Mathematics, 30.03.2020 18:43


