
Mathematics, 09.03.2021 19:10 mophillips20202
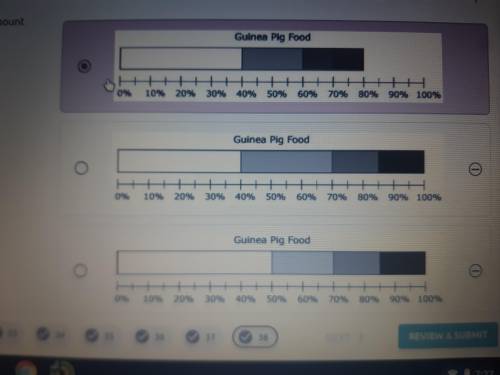
On Saturday Kai gave his guinea pig 80 grams of the food. The table shows the amount of each type of food he gave to the guinea pig. Which percentage bar graph best represents the data?

Answers: 2
Another question on Mathematics
Mathematics, 21.06.2019 15:30
Jonah runs 3/5 miles on sunday and 7/10 mile on monday. he uses the model to find that he can ran a total of 1 mile . what mistake does jonah make
Answers: 2
Mathematics, 21.06.2019 23:00
Y= 4x + 3 y = - 1 4 x - 5 what is the best description for the lines represented by the equations?
Answers: 1
You know the right answer?
On Saturday Kai gave his guinea pig 80 grams of the food. The table shows the amount of each type of...
Questions
Mathematics, 20.03.2021 03:10
Mathematics, 20.03.2021 03:10
Mathematics, 20.03.2021 03:10

History, 20.03.2021 03:10

Mathematics, 20.03.2021 03:10


Chemistry, 20.03.2021 03:10
Mathematics, 20.03.2021 03:10
Mathematics, 20.03.2021 03:10


