
Mathematics, 12.03.2021 14:00 kenaygardel
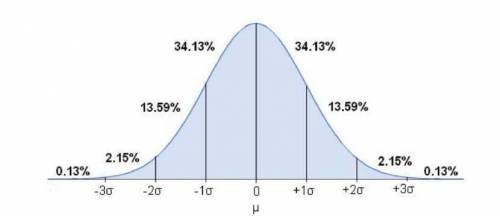
The following figure shows the normal distribution with the proportion of the area under the normal curve contained within one, two, and three standard deviations of the mean. The last proportion on each side, 0.13%, depicts the remaining area under the curve. Specifically, 0.13% of the area under the standard normal distribution is located above z-score values greater than the mean (μ) plus three standard deviations ( +3 ). Also, because the normal distribution is symmetrical, 0.13% of the area under the standard normal distribution is located below z-score values less than the mean (μ) minus three standard deviations (-3 ).
Use the figure to help you answer the following questions: (attached)
The National Assessment of Educational Progress (NAEP) is a nationwide assessment of students' proficiency in nine subjects: mathematics, reading, writing, science, the arts, civics, economics, geography, and U. S. history. The
main NAEP assessments are conducted annually on samples of students from grades 4, 8, and 12.
In 2000, the science scores for female students had a mean of 146 with a standard deviation of 35. Assume that these scores are normally distributed with the given mean and standard deviation.
A score of 41 is _ standard deviations below the mean, while a score
of 251 is _ standard deviations above the mean.
This means that the percentage of female students with scores between 41 and 251 is _ %.
A score of 181 is _ above the mean.
As a result, the percentage of female students with scores below 181 is _ %.
You can infer that 97.72% of the female students have scores above_.

Answers: 1
Another question on Mathematics
Mathematics, 21.06.2019 13:00
(40 points) i need some . an answer definition is appreciated as well.
Answers: 2
Mathematics, 21.06.2019 14:30
Compare these two waves: the blue and orange waves have the same pitch, but the blue wave is louder. the blue and orange waves have the same volume, but the blue wave has a higher pitch. the orange wave has a higher pitch, but the blue wave is louder. the blue wave has a higher pitch, but the orange wave is louder.
Answers: 1
Mathematics, 21.06.2019 20:00
Which type of graph would allow us to quickly see how many students between 100 and 200 students were treated?
Answers: 1
Mathematics, 21.06.2019 22:30
Sketch the vector field vector f( vector r ) = 8vector r in the xy-plane. select all that apply. the length of each vector is 8. the lengths of the vectors decrease as you move away from the origin. all the vectors point away from the origin. all the vectors point in the same direction. all the vectors point towards the origin. the lengths of the vectors increase as you move away from the origin.
Answers: 2
You know the right answer?
The following figure shows the normal distribution with the proportion of the area under the normal...
Questions

Mathematics, 18.12.2020 22:00
Mathematics, 18.12.2020 22:00


Business, 18.12.2020 22:00
English, 18.12.2020 22:00


Spanish, 18.12.2020 22:00
Mathematics, 18.12.2020 22:00
Mathematics, 18.12.2020 22:00

Business, 18.12.2020 22:00


