
Mathematics, 18.03.2021 01:50 bellapimienta8
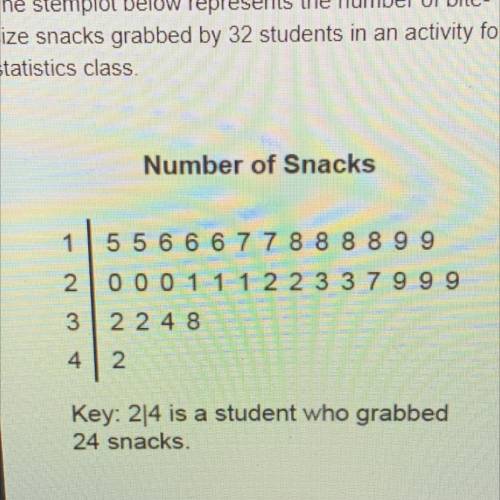
The stemplot below represents the number of bite-size snacks grabbed by 32 students in an activity for a
statistics class. Which of the following best describes the shape of this distribution?
A. Skewed to the left
B. Bimodal symmetric
C. Skewed to the right
D. Unimodal symmetric

Answers: 2
Another question on Mathematics
Mathematics, 21.06.2019 17:00
Drag the tiles to the correct boxes to complete the pairs. match the cart-coordinates with their corresponding pairs of y-coordinates of the unit circle
Answers: 3
Mathematics, 21.06.2019 17:00
In the given figure ar(adf) =ar(cda) and ar(cdf) = ar(cdf). show that abdc and cdfe are trapeziums.
Answers: 2
Mathematics, 21.06.2019 22:20
(b) suppose that consolidated power decides to use a level of significance of α = .05, and suppose a random sample of 100 temperature readings is obtained. if the sample mean of the 100 temperature readings is x⎯⎯ = 60.990, test h0 versus ha and determine whether the power plant should be shut down and the cooling system repaired. perform the hypothesis test by using a critical value and a p-value. assume σ = 5. (round your z to 2 decimal places and p-value to 4 decimal places.)
Answers: 2
Mathematics, 22.06.2019 03:40
Vikram is studying the square pyramid below. on st to find the surface area of the pyramid, in square inches, vikram wrote (33.2) (34 ikram wrote (33.2)(34.2)+43(34.2)(284) what error did vikram make? o he used the same expression for the area of all four lateral faces. he used the wrong expression to represent the area of the base of the pyramid. o he used the wrong value as the height when he found the area of the lateral faces. he used an expression for surface area that only finds the total area of three faces.
Answers: 3
You know the right answer?
The stemplot below represents the number of bite-size snacks grabbed by 32 students in an activity f...
Questions


Geography, 22.02.2020 06:11


Mathematics, 22.02.2020 06:11


