The graph shows the relationship of the number
of gallons being drained from an aquarium over
...

Mathematics, 18.03.2021 02:20 paulusl19
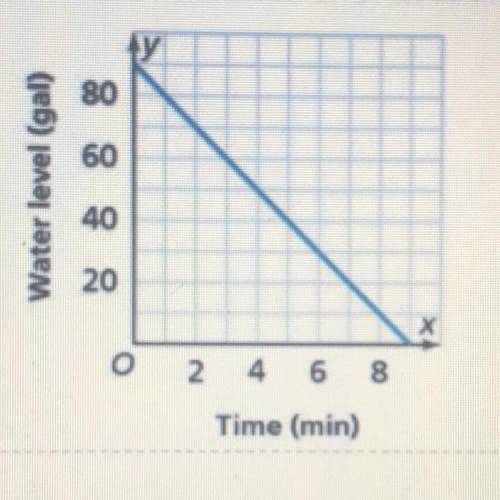
The graph shows the relationship of the number
of gallons being drained from an aquarium over
time. What function models the relationship?
PLEASE HELP!

Answers: 1
Another question on Mathematics
Mathematics, 21.06.2019 19:00
Witch represents the inverse of the function f(x)=1/4x-12
Answers: 1
Mathematics, 21.06.2019 23:30
Peyton's field hockey team wins 4 games out of every 7 games played. her team lost 9 games. how many games did peyton's team play?
Answers: 2
Mathematics, 22.06.2019 02:00
Which polynomial correctly combines the like terms and expresses the given polynomial in standard form? 8mn5 – 2m6 + 5m2n4 – m3n3 + n6 – 4m6 + 9m2n4 – mn5 – 4m3n3 n6 + 7mn5 + 14m2n4 – 5m3n3 – 6m6 –2m6 – 5m3n3 + 14m2n4 + 7mn5 + n6 14m2n4 + 7mn5 – 6m6 – 5m3n3 + n6 n6 – 6m6 + 7mn5 + 14m2n4 – 5m3n3 show work
Answers: 1
You know the right answer?
Questions

History, 19.05.2021 03:20
Mathematics, 19.05.2021 03:20

Mathematics, 19.05.2021 03:20

History, 19.05.2021 03:20
Mathematics, 19.05.2021 03:20
Mathematics, 19.05.2021 03:20
Mathematics, 19.05.2021 03:20


Mathematics, 19.05.2021 03:20


