
Mathematics, 18.03.2021 02:50 AngelyAce
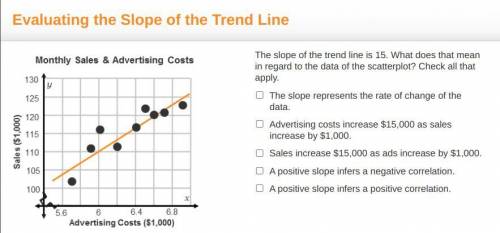
A graph titled Monthly Sales and Advertising Costs has Advertising Costs (1,000 dollars) on the x-axis and sales (1,000 dollars) on the y-axis. A line goes through points (6.4, 117) and (6.6, 120). The slope of the trend line is 15. What does that mean in regard to the data of the scatterplot? Check all that apply. The slope represents the rate of change of the data. Advertising costs increase $15,000 as sales increase by $1,000. Sales increase $15,000 as ads increase by $1,000. A positive slope infers a negative correlation. A positive slope infers a positive correlation.

Answers: 2
Another question on Mathematics
Mathematics, 21.06.2019 15:10
12x + 1 = 25 solve the following equation. then place the correct number in the box provided.
Answers: 2
Mathematics, 21.06.2019 19:10
The linear combination method is applied to a system of equations as shown. 4(.25x + .5y = 3.75) → x + 2y = 15 (4x – 8y = 12) → x – 2y = 3 2x = 18 what is the solution of the system of equations? (1,2) (3,9) (5,5) (9,3)
Answers: 1
Mathematics, 21.06.2019 20:00
The total number of dental clinics total for the last 12 months was recorded
Answers: 3
Mathematics, 21.06.2019 23:00
Find the rate at which the water is now flowing from the tap give your answer cubic centimetres per second
Answers: 1
You know the right answer?
A graph titled Monthly Sales and Advertising Costs has Advertising Costs (1,000 dollars) on the x-ax...
Questions

Business, 08.12.2020 20:30

Mathematics, 08.12.2020 20:30

Social Studies, 08.12.2020 20:30
Mathematics, 08.12.2020 20:30
Mathematics, 08.12.2020 20:30
Mathematics, 08.12.2020 20:30
Mathematics, 08.12.2020 20:30

Physics, 08.12.2020 20:30

Arts, 08.12.2020 20:30

History, 08.12.2020 20:30
Mathematics, 08.12.2020 20:30
History, 08.12.2020 20:30


