
Mathematics, 18.03.2021 03:00 emilysmith20044
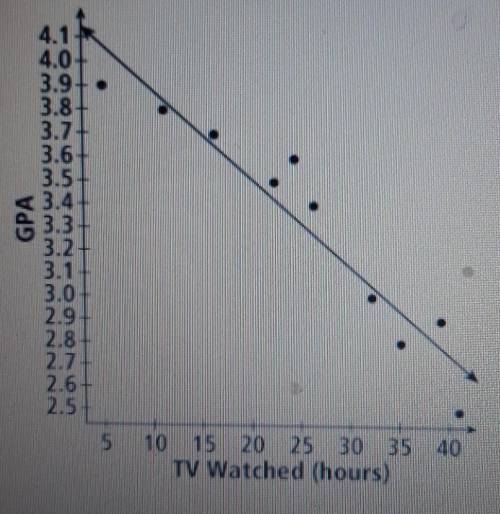
The scatter plot shows the relationship between the number of hours student watch television and their unweighted GPA the equation for the line of best fit y=-0.038x+4.26
based on the trend line what would you expect the GPA for a student who watches television 27 hours per week to be?

Answers: 1
Another question on Mathematics
Mathematics, 21.06.2019 14:50
Brook states that the distance on the line is 4 units. caleb states that the whole line does not have a distance because it continues on forever. vivian states that the line is 6 units long. which distance did brook measure? which distance did vivian measure?
Answers: 3
Mathematics, 21.06.2019 16:50
Which is a true statement comparing the graphs of x^2/6^2-y^2/8^2 = 1 and x^2/8^2-y^2/6^2 the foci of both graphs are the same points. the lengths of both transverse axes are the same. the directrices of = 1 are horizontal while the directrices of = 1 are vertical. the vertices of = 1 are on the y-axis while the vertices of = 1 are on the x-axis.
Answers: 2
Mathematics, 21.06.2019 22:00
Luke wants to reduce the area of his rectangular garden by 1/4 the expression 14/w can be used to represent this change. what is another way to write this expression?
Answers: 1
Mathematics, 21.06.2019 23:30
Peyton's field hockey team wins 4 games out of every 7 games played. her team lost 9 games. how many games did peyton's team play?
Answers: 2
You know the right answer?
The scatter plot shows the relationship between the number of hours student watch television and the...
Questions

History, 24.05.2020 06:57

Biology, 24.05.2020 06:57

Mathematics, 24.05.2020 06:57
Mathematics, 24.05.2020 06:57

Arts, 24.05.2020 06:57

Mathematics, 24.05.2020 06:57
Mathematics, 24.05.2020 06:57
Mathematics, 24.05.2020 06:57


Social Studies, 24.05.2020 06:57


