
Mathematics, 19.03.2021 18:40 gonjul5045
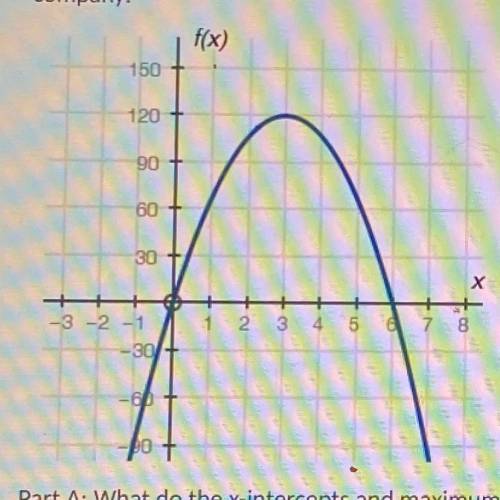
The graph below shows a company's profit f(x), in dollars, depending on the price of goods x, in dollars, being sold by the
company:
Part A: What do the x-intercepts and maximum value of the graph represent?
Part B: What are the intervals where the function is increasing and decreasing, and what do they represent about the sale and
profit?
Part C: What is an approximate average rate of change
the graph from x = 1 to x = 3, and what does this rate represent?

Answers: 1
Another question on Mathematics
Mathematics, 21.06.2019 20:00
If the discriminant if a quadratic equation is 4 which statement describes the roots?
Answers: 3
Mathematics, 22.06.2019 02:30
Abby is collecting rainfall data. she finds that one value of the data set is a high-value outlier. which statement must be true? abby will use a different formula for calculating the standard deviation. the outlier will increase the standard deviation of the data set. the spread of the graph of the data will not change. abby will not use the mean when calculating the standard deviation.
Answers: 3
Mathematics, 22.06.2019 02:30
Build is 120 wide 20 feet high 48 feet long how many cubic feet and the volume
Answers: 1
Mathematics, 22.06.2019 03:00
How many and of which kind of roots does the equation f(x)=2x^4−9x^3+17x^2−16x+6 have?
Answers: 3
You know the right answer?
The graph below shows a company's profit f(x), in dollars, depending on the price of goods x, in dol...
Questions
Mathematics, 15.08.2021 05:50

English, 15.08.2021 05:50
Mathematics, 15.08.2021 05:50
SAT, 15.08.2021 05:50
Mathematics, 15.08.2021 05:50

Social Studies, 15.08.2021 05:50
English, 15.08.2021 05:50
English, 15.08.2021 05:50
Mathematics, 15.08.2021 05:50
Mathematics, 15.08.2021 05:50

Biology, 15.08.2021 05:50

Health, 15.08.2021 05:50
Social Studies, 15.08.2021 05:50


