Given the graph of the piecewise function f(x) below:
- identify all intervals of decrease
-...

Mathematics, 19.03.2021 20:50 emilycolley2
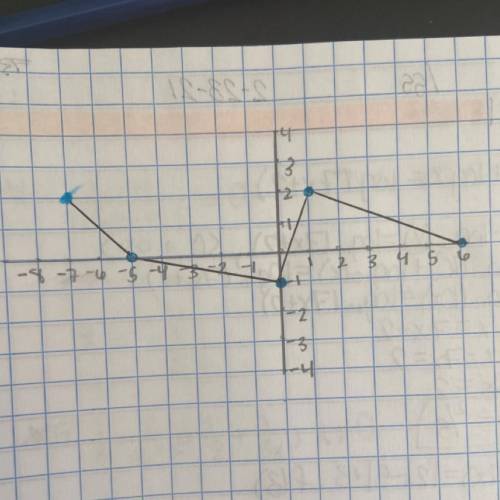
Given the graph of the piecewise function f(x) below:
- identify all intervals of decrease
- identify which interval is decreasing at the greatest rate and explain why
- provide evidence for your conclusion of which interval is decreasing at the greatest rate

Answers: 1
Another question on Mathematics
Mathematics, 21.06.2019 19:00
Use the quadratic formula to solve the equation. if necessary, round to the nearest hundredth. x^2 - 8 = -6x a. –7.12, 1.12 b. 7.12, –1.12 c. 7.12, 1.12 d. –7.12, –1.12
Answers: 2
Mathematics, 21.06.2019 19:40
Which of the binomials below is a factor of this exression? 16x^2+40xy+25y^2 a.4x-5y b. 2x-5y c.4x+5y d.2x+5y
Answers: 2
Mathematics, 21.06.2019 23:30
Segment wx is shown explain how you would construct a perpendicular bisector of wx using a compass and a straightedge
Answers: 1
Mathematics, 21.06.2019 23:30
Apyramid fits exactly inside a cube. the cube and the pyramid share the same square base, and they are both exactly the same height. the volume of the cube is 66 cubic inches. what is the volume of the pyramid? explain your answer. answer asap
Answers: 1
You know the right answer?
Questions

History, 26.07.2019 05:00
Mathematics, 26.07.2019 05:00


Social Studies, 26.07.2019 05:00
Social Studies, 26.07.2019 05:00
History, 26.07.2019 05:00
Biology, 26.07.2019 05:00
Mathematics, 26.07.2019 05:00

Biology, 26.07.2019 05:00


