
Mathematics, 22.03.2021 18:10 christine44gordon
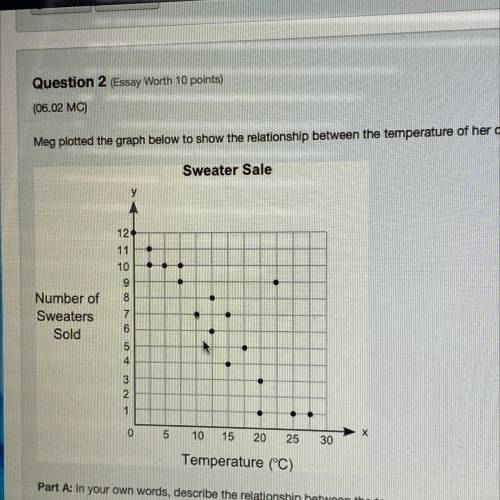
Meg plotted the graph below to show the relationship between the temperature of her city and the number of sweaters sold at a store:
Sweater Sale
Number of
Sweaters
Sold
12
11
10
9
8
7
6
5
4
3
2
1
0 5 10 15 20 25 30
Temperature (°C)
Part A: In your own words, describe the relationship between the temperature of the city and the sale of sweaters in the city (5 points)
Part B: Describe how you can make the line of best fit. Write the approximate slope and y-intercept of the line of best fit. Show your work, including the points that you use to
calculate slope and y-Intercept. (5 points)

Answers: 3
Another question on Mathematics
Mathematics, 21.06.2019 21:00
What is the unit rate of, 75% high fiber chimp food to 25% high protein chimp food.
Answers: 1
Mathematics, 21.06.2019 23:00
Acarton of juice contains 64 ounces miss wilson bought six cartons of juice how many ounces of juice did she buy
Answers: 2
Mathematics, 22.06.2019 02:00
The half-life of a certain material is 0.004 second. approximately how much of a 20-gram sample will be left after 0.016 second? a. 5 grams b. 16 grams c. 0.32 gram d. 1.25 grams
Answers: 3
Mathematics, 22.06.2019 04:20
If the class creates a histogram of the data in table, how many students are in the range 12cm to 13.9 cm
Answers: 1
You know the right answer?
Meg plotted the graph below to show the relationship between the temperature of her city and the num...
Questions


Arts, 17.12.2020 02:10
Mathematics, 17.12.2020 02:10
Mathematics, 17.12.2020 02:10
Arts, 17.12.2020 02:10


English, 17.12.2020 02:10
Mathematics, 17.12.2020 02:10
Mathematics, 17.12.2020 02:10
English, 17.12.2020 02:10
Mathematics, 17.12.2020 02:10


