Which relation is displayed in the graph?
a.
{(–4, –3), (2, 2), (2, 1), (0, 3) (–2, 4)...

Mathematics, 19.08.2019 07:00 cyriagirl
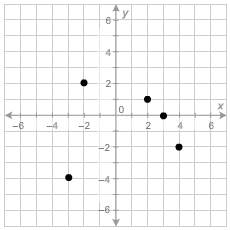
Which relation is displayed in the graph?
a.
{(–4, –3), (2, 2), (2, 1), (0, 3) (–2, 4)}
b.
{(–3, –4), (2, –2), (2, 1), (3, 0) (4, –2)}
c.
{(–3, –4), (–2, 2), (2, 1), (3, 0) (4, –2)}
d.
{(–3, 4), (–2, –2), (1, 2), (3, 0) (4, 2)}

Answers: 1
Another question on Mathematics
Mathematics, 21.06.2019 18:40
Dexter read 11 science fiction books and 5 history books. lena read 9 science fiction books and 4 history books. compare the students’ ratios of science fiction books to history books. 1. determine the ratios’ form: science fiction books to history books 2. write the ratios as fractions: dexter: 115; lena: 94 3. rewrite with a common denominator. 4. compare. 5. answer the question. determine which shows the correct comparison of the ratios for this problem.
Answers: 1
Mathematics, 21.06.2019 19:40
What is the slope of the line that contains the points (-2,1) and (0,-3)
Answers: 2
Mathematics, 22.06.2019 00:30
Jaxon has s packs of 8 crazy straws. he divided the crazy straws into 2 equal bags. now, he has 224 crazy straws in each bag. how many packs of crazy straws did jaxon start with?
Answers: 1
You know the right answer?
Questions
Mathematics, 06.11.2020 04:10

History, 06.11.2020 04:10
History, 06.11.2020 04:10

History, 06.11.2020 04:10
Mathematics, 06.11.2020 04:10
Mathematics, 06.11.2020 04:10
Mathematics, 06.11.2020 04:10


English, 06.11.2020 04:10

Spanish, 06.11.2020 04:10


