The graph of a quadratic function is shown on the grid
x
-3 -2
1
2
3
...

Mathematics, 23.03.2021 18:50 daydallas01
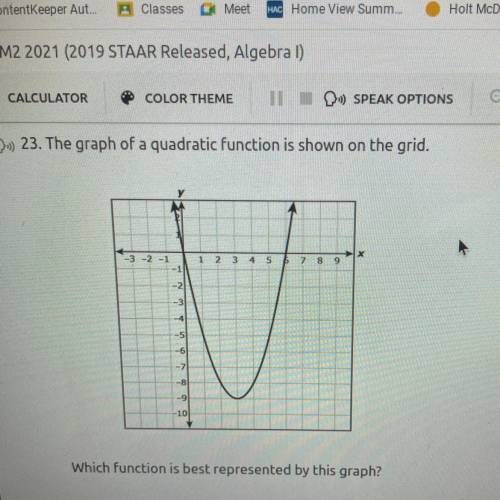
The graph of a quadratic function is shown on the grid
x
-3 -2
1
2
3
4
5
2
8
9
-1
یہ بن
-6
-7
-8
-9
10
Which function is best represented by this graph?

Answers: 3
Another question on Mathematics
Mathematics, 21.06.2019 14:00
Roger and natalie travel in similar cars. roger's car drives the two miles to school in 7.5 minutes. natalie drives the same distance in the opposite direction but in only 6.5 minutes. what is true of their velocities?
Answers: 1
Mathematics, 21.06.2019 19:50
If the scale factor between two circles is 2x/5y what is the ratio of their areas?
Answers: 3
Mathematics, 21.06.2019 20:00
Evaluate the discriminant of each equation. tell how many solutions each equation has and whether the solutions are real or imaginary. x^2 + 4x + 5 = 0
Answers: 2
Mathematics, 22.06.2019 00:30
Ahovercraft takes off from a platform. its height (in meters), xx seconds after takeoff, is modeled by: h(x)=-2x^2+20x+48h(x)=−2x 2 +20x+48 what is the maximum height that the hovercraft will reach?
Answers: 3
You know the right answer?
Questions


Social Studies, 09.12.2021 03:10


Computers and Technology, 09.12.2021 03:10
Mathematics, 09.12.2021 03:10
Social Studies, 09.12.2021 03:10
Computers and Technology, 09.12.2021 03:10
SAT, 09.12.2021 03:10


