Question 3 (Essay Worth 10 points)
(06.04 MC)
The graph shows the relationship between the nu...

Mathematics, 24.03.2021 01:00 emma042902
Question 3 (Essay Worth 10 points)
(06.04 MC)
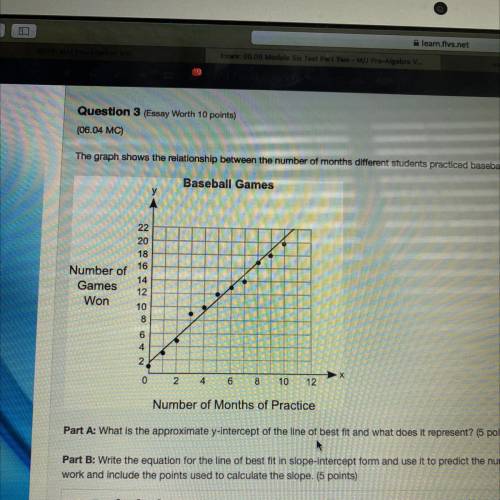
The graph shows the relationship between the number of months different students practiced baseball and the number of games they won:
Baseball Games
y
Number of
Games
Won
22
20
18
16
14
12
10
8
6
4
2
0
2
4
6
8
10
12
Number of Months of Practice
Part A: What is the approximate y-intercept of the line of best fit and what does it represent? (5 points)
Part B: Write the equation for the line of best fit in slope-intercept form and use it to predict the number of games that could be won after 13 months of practice. Show your
work and include the points used to calculate the slope. (5 points)

Answers: 2
Another question on Mathematics
Mathematics, 21.06.2019 17:30
The table shows the balance of a money market account over time. write a function that represents the balance y(in dollars) after t years.
Answers: 2
Mathematics, 21.06.2019 23:40
The function f(x)= -(x+5)(x+1) is down. what is the range of the function?
Answers: 3
You know the right answer?
Questions

English, 20.02.2020 01:33
Mathematics, 20.02.2020 01:33

Social Studies, 20.02.2020 01:33


Chemistry, 20.02.2020 01:33
Mathematics, 20.02.2020 01:33


Biology, 20.02.2020 01:33
Mathematics, 20.02.2020 01:34
Mathematics, 20.02.2020 01:34

Computers and Technology, 20.02.2020 01:34
Physics, 20.02.2020 01:34


