subject
Mathematics, 24.03.2021 20:50 colochaortiz20p7cajw

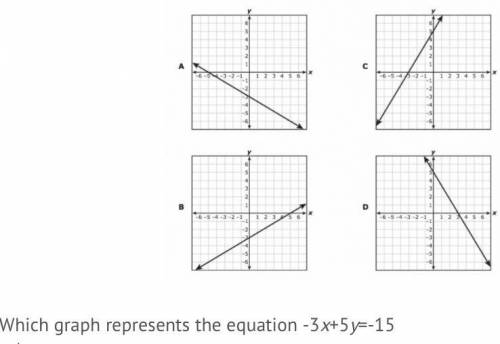
Which graph represents the equation -3 x + 5 y = -15 A. Graph A
B. Graph B
C. Graph C
D. Graph D


Which graph represents the equation -3 x + 5 y = -15

A. Graph A
B. Graph B
C. Graph C
D. Graph D

ansver
Answers: 2

Another question on Mathematics

question
Mathematics, 21.06.2019 16:00
Areal estate agent earns $32,000 a year plus $1,000 for each apartment he sells. write an equation that shows the relationship between the number of apartments abe sells,n, and the total amount he earns in a year,e. what is the total amount abe would earn from selling 10 apartments in one year
Answers: 3
question
Mathematics, 21.06.2019 19:30
The measure of an angle is 117°. what is the measure of a supplementary angle?
Answers: 2
question
Mathematics, 21.06.2019 20:30
Answer asap ill give ! ’ a sample of radioactive material decays over time. the number of grams, y , of the material remaining x days after the sample is discovered is given by the equation y = 10(0.5)^x. what does the number 10 represents in the equation? a. the half-life of the radioactive material, in days b. the amount of the sample, in grams, that decays each day c. the time, in days, it will take for the samples to decay completely d. the size of the sample, in grams, at the time the material was discovered
Answers: 1
question
Mathematics, 21.06.2019 22:00
The birth weights of newborn babies in the unites states follow in a normal distrubution with a mean of 3.4 kg and standard deviation of 0.6 kg. reaserches interested in studying how. children gain weights decide to take random samples of 100 newborn babies and calculate the sample mean birth weights for each sample
Answers: 1
You know the right answer?
Which graph represents the equation -3 x + 5 y = -15 A. Graph A
B. Graph B
C. Graph C
Questions
Questions on the website: 13722360