Could someone help me ? <33 Lesson 1 Skills Practice
Scatterplots
Explain whether the scat...

Mathematics, 25.03.2021 19:00 jordonlewis
Could someone help me ? <33 Lesson 1 Skills Practice
Scatterplots
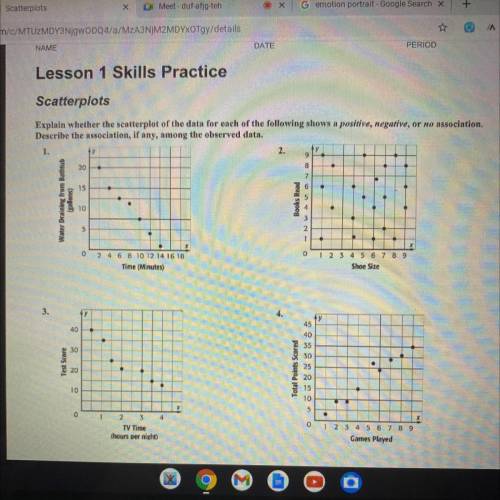
Explain whether the scatterplot of the data for each of the following shows a positive, negative, or no association.
Describe the association, if any, among the observed data.
1.
2. у
20
9
8
7
6
15
Water Draining from Bathtub
(suoje
Books Read
10
1
0
0
2 4 6 8 10 12 14 16 18
Time (Minutes)
1 2 3 4 5 6 7 8 9
Shoe Size
3.
У
45
40
30
Test Score
.
20
Total Points Scored
40
35
9 30
25
20
15
10
10
5
0

Answers: 1
Another question on Mathematics
Mathematics, 21.06.2019 17:30
Write the fraction 9/50 as a decimal if needed round to the nearest hundredth
Answers: 2
Mathematics, 21.06.2019 18:00
Henry is an avid reader, he devours 90 pages in half an hour how many pages has henry read per minute?
Answers: 1
Mathematics, 21.06.2019 20:00
Find the slope of the line passing through a pair of points
Answers: 2
Mathematics, 21.06.2019 22:50
1. if events a and b are non-overlapping events, how do you find the probability that one or the other occurs? 2. what does it mean if p(a or b) equals 1?
Answers: 2
You know the right answer?
Questions

English, 23.08.2019 06:10
Mathematics, 23.08.2019 06:10

Geography, 23.08.2019 06:10
Mathematics, 23.08.2019 06:10

History, 23.08.2019 06:10
Mathematics, 23.08.2019 06:10


Mathematics, 23.08.2019 06:10


