
Mathematics, 25.03.2021 20:40 Reagan650
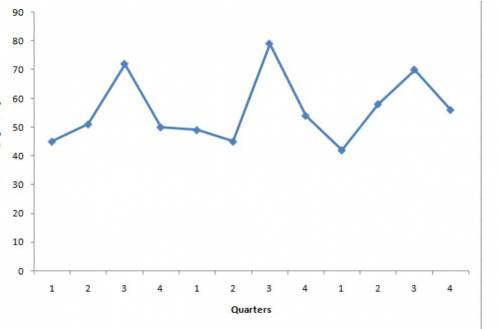
The following data shows the quarterly profit (in thousands of dollars) made by a particular company in the past 3 years.
Year Quarter Profit ($1000s)
1 1 45
1 2 51
1 3 72
1 4 50
2 1 49
2 2 45
2 3 79
2 4 54
3 1 42
3 2 58
3 3 70
3 4 56
Required:
a. Construct a time series plot. What type of pattern exists in the data?
b. Develop a three-period moving average for this time series. Compute MSE and a forecast of profit (in $1000s) for the next quarter.

Answers: 1

Another question on Mathematics
Mathematics, 21.06.2019 15:00
Solve the word problem. the table shows the low outside temperatures for monday, tuesday, and wednesday. by how many degrees did the low temperature increase from monday to tuesday? this function table shows the outside temperature for a given a. 21.1⁰ b. 8.6⁰ c. 4.9⁰ d. 3.9⁰(the picture is the graph the the question is talking about.)
Answers: 1
Mathematics, 21.06.2019 17:30
The train station clock runs too fast and gains 5 minutes every 10 days. how many minutes and seconds will it have gained at the end of 9 days?
Answers: 2
Mathematics, 21.06.2019 18:30
Find an equation of the line perpendicular to the graph of 28x-7y=9 that passes through the point at (4,1)
Answers: 2
Mathematics, 21.06.2019 21:00
Mr.zimmerman invested $25,000 in an account that draws 1.4 interest, compouneded annually. what is the total value of the account after 15 years
Answers: 1
You know the right answer?
The following data shows the quarterly profit (in thousands of dollars) made by a particular company...
Questions
Mathematics, 11.03.2021 23:30


Health, 11.03.2021 23:30
English, 11.03.2021 23:30

Geography, 11.03.2021 23:30

Chemistry, 11.03.2021 23:30

Mathematics, 11.03.2021 23:30
Mathematics, 11.03.2021 23:30


