Center City
2. The population of Center City is modeled
by exponential function f, where x is...

Mathematics, 26.03.2021 20:10 hernandez09297
Center City
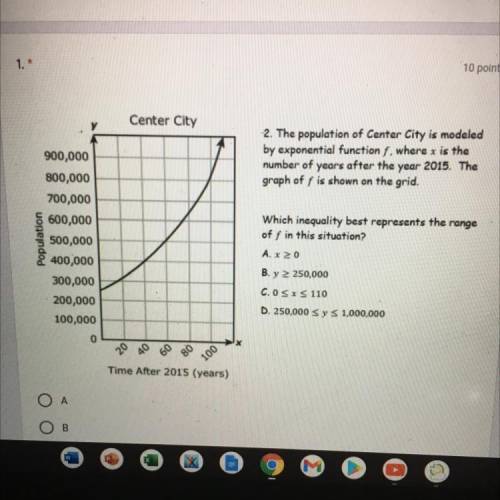
2. The population of Center City is modeled
by exponential function f, where x is the
number of years after the year 2015. The
graph of f is shown on the grid.
Population
900,000
800,000
700,000
600,000
500,000
400,000
300,000
200,000
100,000
Which inequality best represents the range
of f in this situation?
A. x 20
B. y 2 250,000
C. OSXS 110
D. 250,000 Sy S 1,000,000
0
20 060
80
100
Time After 2015 (years)

Answers: 1
Another question on Mathematics
Mathematics, 20.06.2019 18:04
Find the missing part. use an improper fraction for your answer.
Answers: 1
Mathematics, 21.06.2019 16:20
Tomas is making trail mix using granola and walnuts. he can spend a total of $12 on the ingredients. he buys 3 pounds of granola that costs $2.00 per pound. the walnuts cost $6 per pound. he uses the equation to represent the total cost, where x represents the number of pounds of granola and y represents the number of pounds of walnuts. he solves the equation for y, the number of pounds of walnuts he can buy. answer- b tomas added 6 to both sides of the equation instead of subtracting 6. just took the test
Answers: 1
Mathematics, 21.06.2019 20:00
Which of these tools or constructions is used to inscribe a hexagon inside a circle?
Answers: 1
You know the right answer?
Questions

English, 16.02.2021 14:00
English, 16.02.2021 14:00

Computers and Technology, 16.02.2021 14:00

Mathematics, 16.02.2021 14:00


Biology, 16.02.2021 14:00
Mathematics, 16.02.2021 14:00
Biology, 16.02.2021 14:00

Physics, 16.02.2021 14:00
Arts, 16.02.2021 14:00
Mathematics, 16.02.2021 14:00


History, 16.02.2021 14:00

Social Studies, 16.02.2021 14:00
Mathematics, 16.02.2021 14:00


