
Mathematics, 26.03.2021 21:00 dadonelson2109
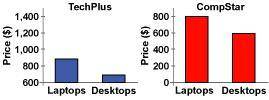
The graphs below were created by an advertising agency for the computer store TechPlus to show its average price on laptops and desktops compared to another computer store's prices.
Which of the following statements best explains how the advertising agency misrepresented the data?
The graphs use different scales, making it appear that the prices at TechPlus are much lower than CompStar.
The graphs were created with different colors.
The graph for CompStar makes its prices appear much higher, but its prices are only a little higher.
The graphs do not include tablet computers, so there is not enough information to compare their prices.

Answers: 1
Another question on Mathematics
Mathematics, 20.06.2019 18:04
Me find the measure to side c and the process to solve the problem you appreciate it : )
Answers: 1
Mathematics, 21.06.2019 12:30
What is the approximate total length of iron edging needed to create the square frame and the two diagonals?
Answers: 3
Mathematics, 21.06.2019 23:00
What is the location of point g, which partitions the directed line segment from d to f into a 5: 4 ratio? –1 0 2 3
Answers: 1
You know the right answer?
The graphs below were created by an advertising agency for the computer store TechPlus to show its a...
Questions


English, 10.03.2022 05:30
Mathematics, 10.03.2022 05:30

French, 10.03.2022 05:30

Arts, 10.03.2022 05:40
Mathematics, 10.03.2022 05:40

History, 10.03.2022 05:40
Mathematics, 10.03.2022 05:40


Mathematics, 10.03.2022 05:40
History, 10.03.2022 05:40
English, 10.03.2022 05:40

Mathematics, 10.03.2022 05:40
Mathematics, 10.03.2022 05:40


