SECTION B
21. The Venn diagram below shows the number of pupils who like Math (M) and
Science...

Mathematics, 28.03.2021 14:20 gg12344
SECTION B
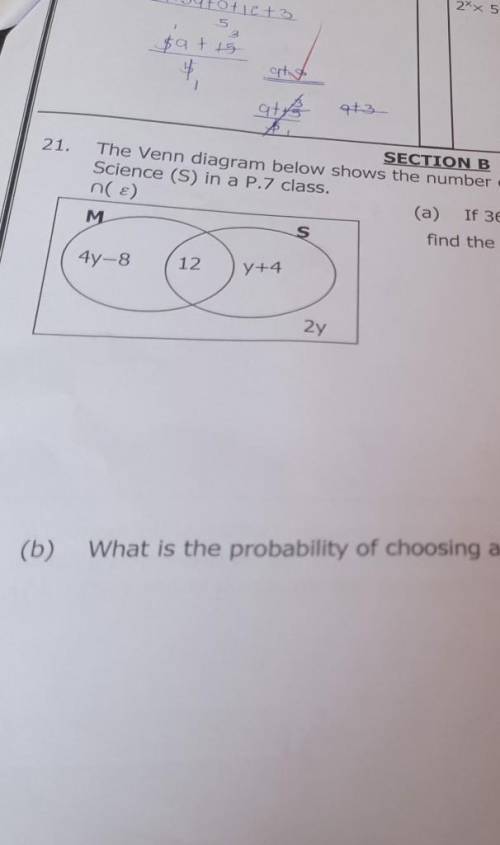
21. The Venn diagram below shows the number of pupils who like Math (M) and
Science (S) in a P.7 class.
n( €)
(a) If 36 pupils like only one subject,
M
S
find the value of y. (3marks)
44-8
12
y+4
2y
(b) What is the probability of choosing a pupil who does not like Science?
(2 marks)

Answers: 1
Another question on Mathematics
Mathematics, 21.06.2019 13:30
Estimate the product. round the first factor to the nearest whole number, round the second factor to the nearest ten, and then multiply. 3 8/9 × 96
Answers: 3
Mathematics, 21.06.2019 17:00
How to solve a simultaneous equation involved with fractions?
Answers: 1
Mathematics, 22.06.2019 00:30
Nellie is analyzing a quadratic function f(x) and a linear function g(x). will they intersect? f(x) g(x) graph of the function f of x equals one half times x squared, plus 2 x g(x) 1 5 2 10 3 15
Answers: 2
You know the right answer?
Questions

English, 14.05.2021 21:50

History, 14.05.2021 21:50


French, 14.05.2021 21:50
Mathematics, 14.05.2021 21:50

Mathematics, 14.05.2021 21:50

Chemistry, 14.05.2021 21:50
Mathematics, 14.05.2021 21:50
Mathematics, 14.05.2021 21:50

Arts, 14.05.2021 21:50


