
Mathematics, 29.03.2021 08:00 slpsoniaa
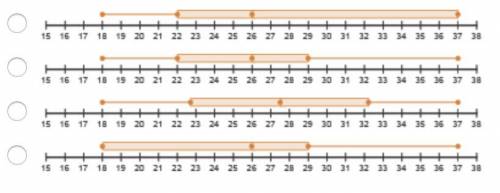
The number of bus riders was recorded on one route. The data have these values: minimum = 18, lower quartile = 22, median = 26, upper quartile = 29, and maximum = 37. Which box plot represents the data?

Answers: 3
Another question on Mathematics
Mathematics, 21.06.2019 16:40
Which of the following is the correct equation for this function? a. y= (x+4)(x+2) b. y=x^2+ 3x – 2 c. y+ 2 = – 2(x+3)^2 d. y+ 2 = 2(x+3)^2
Answers: 1
Mathematics, 21.06.2019 20:30
You’re giving a cube with a length of 2.5 cm and a width of 2.5 cm and a high of 2.5 cm you place it on a scale and it is 295 g calculate the density
Answers: 1
Mathematics, 21.06.2019 20:50
The cost of turkey is directly proportional to its weight. if a 12-pount turkey costs $27, how much does a 16-pound turkey cost? a. $33.75 b. $36.00 c. $31.00 d. $32.50
Answers: 3
Mathematics, 22.06.2019 01:00
First work with stencil one. use a combination of reflections, rotations, and translations to see whether stencil one will overlap with the original pattern. list the sequence of rigid transformations you used in your attempt, noting the type of transformation, the direction, the coordinates, and the displacement
Answers: 3
You know the right answer?
The number of bus riders was recorded on one route. The data have these values: minimum = 18, lower...
Questions
Mathematics, 17.07.2019 11:10

Biology, 17.07.2019 11:10

History, 17.07.2019 11:10

Chemistry, 17.07.2019 11:10
Mathematics, 17.07.2019 11:10

English, 17.07.2019 11:10
Mathematics, 17.07.2019 11:20

Mathematics, 17.07.2019 11:20
Mathematics, 17.07.2019 11:20


