Mathematics, 30.03.2021 14:00 heyysn3858
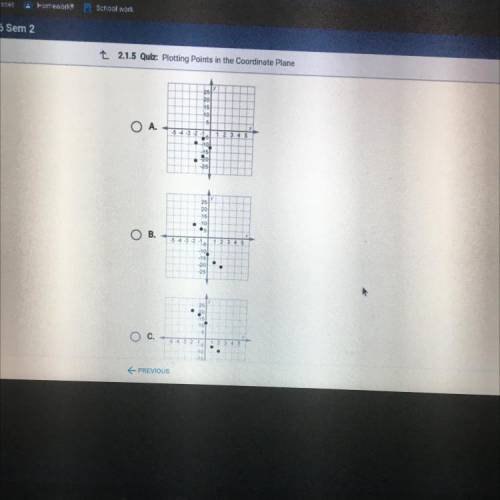
Tanner planned a camping trip during the winter. He kept
track of the daily low temperature at the campsite before
and after he arrived. He labeled his arrival date as "Day 0,"
with the days counting down to the trip as negative
numbers. The table displays his data.
Day of trip Low temperature (°F)
-2
21
-1
18
0
12
1
2
-9
Which graph shows the data?


Answers: 2
Another question on Mathematics

Mathematics, 21.06.2019 17:00
Benito is selecting samples of five values from the table, which row will result in the greatest mean? population data row 1 4 2 2 3 3 row 2 3 3 4 3 2 row 3 2 4 3 4 3 row 4 3 4 4 7 3 row 1 row 2 r
Answers: 3


Mathematics, 21.06.2019 19:50
A3-dimensional figure has a square base and 4 lateral faces that meet at a point. explain the difference between the cross sections when a slice is made perpendicular to the base through the vertex, and when a slice is made perpendicular to the base and not through the vertex
Answers: 2

You know the right answer?
Tanner planned a camping trip during the winter. He kept
track of the daily low temperature at the...
Questions


Chemistry, 04.07.2021 01:50

Mathematics, 04.07.2021 01:50


Mathematics, 04.07.2021 01:50

Biology, 04.07.2021 01:50


Chemistry, 04.07.2021 01:50

History, 04.07.2021 01:50


History, 04.07.2021 01:50

Social Studies, 04.07.2021 01:50

English, 04.07.2021 01:50


