Please help me
Will give you
The data shown in the table below represents the weight,...

Mathematics, 30.03.2021 17:20 JANA279
Please help me
Will give you
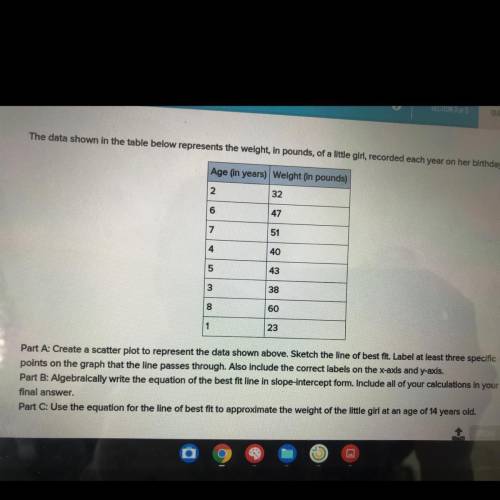
The data shown in the table below represents the weight, in pounds, of a little girl, recorded each year on her birthday.
Part A: Create a scatter plot to represent the data shown above. Sketch the line of best fit. Label at least three specific
points on the graph that the line passes through. Also include the correct labels on the x-axis and y-axis.
Part B: Algebraically write the equation of the best fit line in slope-intercept form. Include all of your calculations in your
final answer.
Part C: Use the equation for the line of best fit to approximate the weight of the little girl at an age of 14 years old.

Answers: 1
Another question on Mathematics
Mathematics, 21.06.2019 18:30
What is the value of x in the following equation? -3x-2=2x+8
Answers: 1
Mathematics, 21.06.2019 22:00
Luke wants to reduce the area of his rectangular garden by 1/4 the expression 14/w can be used to represent this change. what is another way to write this expression?
Answers: 1
You know the right answer?
Questions

Social Studies, 20.07.2019 04:30


History, 20.07.2019 04:30
Social Studies, 20.07.2019 04:30

History, 20.07.2019 04:30
History, 20.07.2019 04:30
History, 20.07.2019 04:30
History, 20.07.2019 04:30


