The diagram below represents a normal distribution.
А | В
CDE
F
What percent of t...

Mathematics, 06.04.2021 20:20 sanakhalid9728
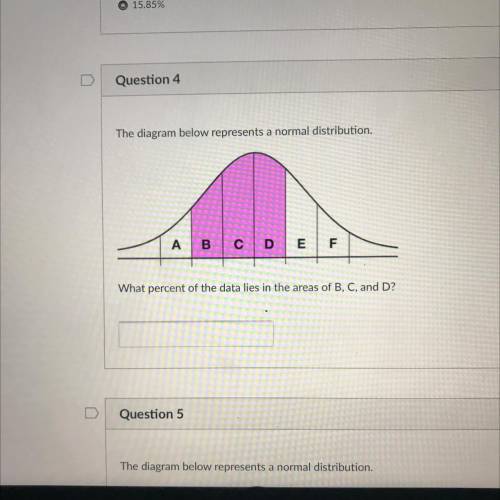
The diagram below represents a normal distribution.
А | В
CDE
F
What percent of the data lies in the areas of B, C, and D?

Answers: 3
Another question on Mathematics
Mathematics, 21.06.2019 19:00
Suppose that one doll house uses the 1 inch scale, meaning that 1 inch on the doll house corresponds to 1/2 foot for life-sized objects. if the doll house is 108 inches wide, what is the width of the full-sized house that it's modeled after? in inches and feet.
Answers: 2
Mathematics, 21.06.2019 21:30
Miss henderson wants to build a fence around a rectangular garden in her backyard in the scale drawing the perimeter of the garden is 14 in of the actual length of a b is 20 ft how many feet of fencing what you need
Answers: 3
Mathematics, 22.06.2019 01:00
Tobias gold sells computers at the office center he's guaranteed a minimum salary of $1,959 per month plus 6.3% commission on total sales how much in total sales is he
Answers: 1
Mathematics, 22.06.2019 02:40
Arestaurant manager wanted to get a better understanding of the tips her employees earn, so she decided to record the number of patrons her restaurant receives over the course of a week, as well as how many of those patrons left tips of at least 15%. the data she collected is in the table below. day mon tue wed thu fri sat sun patrons 126 106 103 126 153 165 137 tippers 82 87 93 68 91 83 64 which day of the week has the lowest experimental probability of patrons tipping at least 15%? a. sunday b. saturday c. friday d. thursday
Answers: 1
You know the right answer?
Questions

Medicine, 21.05.2021 16:30
Mathematics, 21.05.2021 16:30


Business, 21.05.2021 16:30

Chemistry, 21.05.2021 16:30
Mathematics, 21.05.2021 16:30

English, 21.05.2021 16:30

Mathematics, 21.05.2021 16:30
Mathematics, 21.05.2021 16:30

Spanish, 21.05.2021 16:30


