
Mathematics, 06.04.2021 22:20 jay0630
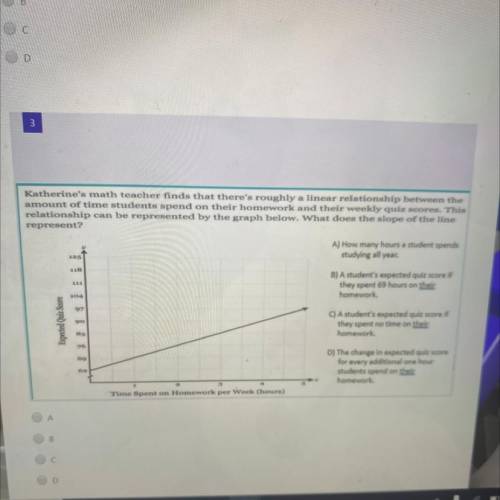
Katherine's math teacher finds that there's roughly a linear relationship between the
amount of time students spend on their homework and their weekly quiz scores. This
relationship can be represented by the graph below. What does the slope of the line
represent?
A) How many hours a student spends
studying all year.
B) A student's expected quiz score if
they spent 69 hours on their
homework.
195
118
111
104
07
Expected Quiz Score
90
C) A student's expected quiz score if
they spent no time on their
homework.
83
76
69
D) The change in expected quiz score
for every additional one hour
students spend on their
homework.
63
Time Spent on Homework per week (hours)

Answers: 3
Another question on Mathematics
Mathematics, 20.06.2019 18:04
Which expressions are equivalent to the one below? check all that apply. 25x/5x a. 5x b. 5 c. 5x•5x/5x d. 25x e. (25/5)^x f. (25-5)^x
Answers: 1
Mathematics, 21.06.2019 15:00
This is the number of parts out of 100, the numerator of a fraction where the denominator is 100. submit
Answers: 3
Mathematics, 21.06.2019 15:10
Figure abcde is a regular pentagon. segment ae is located at a (2, 1) and e (4, 1). what is the perimeter of abcde? 4 units 6 units 8 units 10 units
Answers: 1
Mathematics, 21.06.2019 17:40
Im gonna fail 7th grade selective breeding 1. creates offspring which are genetically identical to the parent 2. is the process of breeding only organisms with desirable traits 3. involves the removal of the nucleus of a cell 4. combines traits from organisms of different species
Answers: 2
You know the right answer?
Katherine's math teacher finds that there's roughly a linear relationship between the
amount of tim...
Questions


Chemistry, 01.08.2019 07:30
Mathematics, 01.08.2019 07:30

Spanish, 01.08.2019 07:30
Mathematics, 01.08.2019 07:30
Mathematics, 01.08.2019 07:30
Mathematics, 01.08.2019 07:30
History, 01.08.2019 07:30
Mathematics, 01.08.2019 07:30
Mathematics, 01.08.2019 07:30


