
Mathematics, 07.04.2021 21:40 SKYBLUE1015
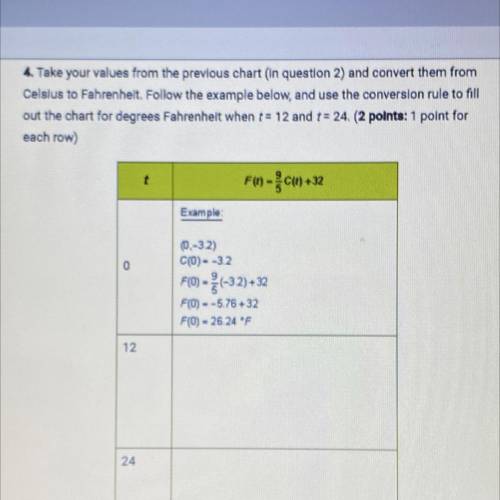
4. Take your values from the previous chart (In question 2) and convert them from
Celsius to Fahrenheit. Follow the example below, and use the conversion rule to fill
out the chart for degrees Fahrenheit when t = 12 and t = 24. (2 polnts: 1 point for
each row)
FO-c«) +32
Example
(0,-32)
C(O)- -3.2
0
FCO) - (-32)+32
F(0) - -5.76 +32
FO) - 26.24 F
12

Answers: 1
Another question on Mathematics
Mathematics, 21.06.2019 19:40
Ascatter plot with a trend line is shown below. which equation best represents the given data? y = x + 2 y = x + 5 y = 2x + 5
Answers: 1
Mathematics, 21.06.2019 20:00
Someone answer asap for ! max recorded the heights of 500 male humans. he found that the heights were normally distributed around a mean of 177 centimeters. which statements about max’s data must be true? a. the median of max’s data is 250 b. more than half of the data points max recorded were 177 centimeters. c. a data point chosen at random is as likely to be above the mean as it is to be below the mean. d. every height within three standard deviations of the mean is equally likely to be chosen if a data point is selected at random.
Answers: 1
Mathematics, 21.06.2019 20:30
The cost for an uberi is $2.50 plus $2.00 mile. if the total for the uber ride was $32.50, how many miles did the customer travel?
Answers: 3
Mathematics, 22.06.2019 00:20
Last week , donnell practiced the piano 3 hours longer than marcus . together, marcus and donnell practiced the piano 11 hours . for how many hours did each young man practiced the piano
Answers: 3
You know the right answer?
4. Take your values from the previous chart (In question 2) and convert them from
Celsius to Fahren...
Questions


History, 18.09.2019 16:00
History, 18.09.2019 16:00
Mathematics, 18.09.2019 16:00
Mathematics, 18.09.2019 16:00
Biology, 18.09.2019 16:00


Chemistry, 18.09.2019 16:00

Social Studies, 18.09.2019 16:00
Mathematics, 18.09.2019 16:00
Social Studies, 18.09.2019 16:00


