
Mathematics, 07.04.2021 22:20 jahootey3042
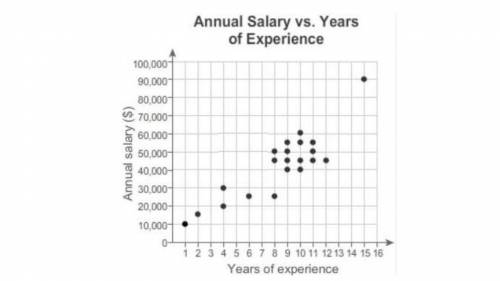
The scatter plot shows the relationship between annual salary and years of experience. What is the range of the cluster shown in the scatter plot?
A) 1 to 15 years of experience
B) 8 to 12 years of experience
C) $10,000 to $90,000 annual salary
D) $40,000 to $60,000 annual salary

Answers: 2

Another question on Mathematics
Mathematics, 21.06.2019 15:00
Select the correct answer from the drop-down menu. this graph represents the inequality x+2< 4,2x> 3,x+6< 12,2x> 12
Answers: 2
Mathematics, 21.06.2019 20:30
Someone me what is the area of this figure? 18m 18m 8m 16m
Answers: 2
You know the right answer?
The scatter plot shows the relationship between annual salary and years of experience. What is the r...
Questions
Mathematics, 15.07.2020 01:01


Computers and Technology, 15.07.2020 01:01


Mathematics, 15.07.2020 01:01

Mathematics, 15.07.2020 01:01


