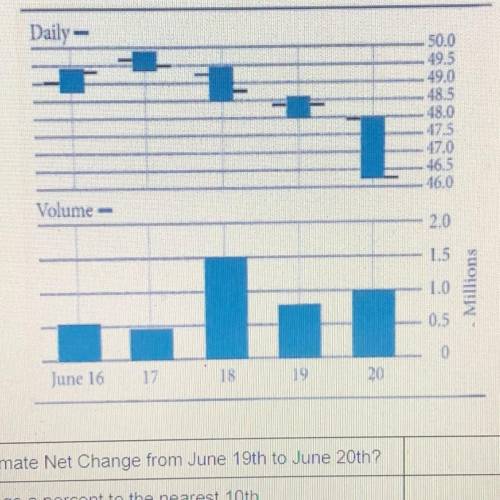
2. Use the Bar Graph to answer the following questions:
Daily -
50.0
49.5
49.0
48.5
48.0
47.5
47.0
46,5
46,0
Volume
2.0
1.5
1.0
u
Millions
0.5
0
June 16
17
18
19
20
What was the approximate Net Change from June 19th to June 20th?
Express the Net Change a percent to the nearest 10th.