
Homework: Section 7.2
Question Help
Match each P-value with the graph that displays its area...

Mathematics, 11.04.2021 19:10 ashtonsilvers2003
Homework: Section 7.2
Question Help
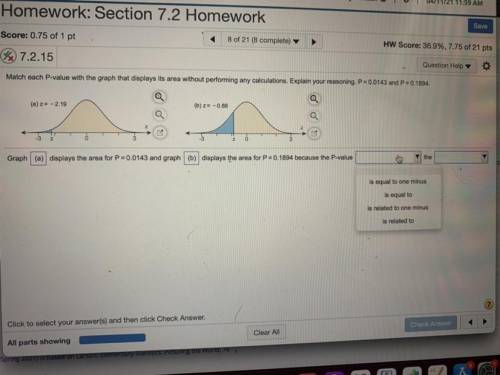
Match each P-value with the graph that displays its area without performing any calculations. Explain your reasoning. P=0.0143 and P = 0.1894.
a
(a) z = -2.19
(b) = -0.88
Graph (a) displays the area for P=0.0143 and graph (b) displays the area for} = 0.1894 because the P blank the blank

Answers: 3
Another question on Mathematics
Mathematics, 21.06.2019 14:20
Triangle abc is reflected over the line y=x triangle abc has points (-6,-,-1) and (-5,-6) what is the c coordinate
Answers: 1
Mathematics, 21.06.2019 17:00
The table shows population statistics for the ages of best actor and best supporting actor winners at an awards ceremony. the distributions of the ages are approximately bell-shaped. compare the z-scores for the actors in the following situation. best actor best supporting actor muequals42.0 muequals49.0 sigmaequals7.3 sigmaequals15 in a particular year, the best actor was 59 years old and the best supporting actor was 45 years old. determine the z-scores for each. best actor: z equals best supporting actor: z equals (round to two decimal places as needed.) interpret the z-scores. the best actor was (more than 2 standard deviations above more than 1 standard deviation above less than 1 standard deviation above less than 2 standard deviations below) the mean, which (is not, is) unusual. the best supporting actor was (less than 1 standard deviation below more than 1 standard deviation above more than 2 standard deviations below more than 1 standard deviation below) the mean, which (is is not) unusual.
Answers: 1
Mathematics, 21.06.2019 20:00
Elizabeth is using a sample to study american alligators. she plots the lengths of their tails against their total lengths to find the relationship between the two attributes. which point is an outlier in this data set?
Answers: 1
Mathematics, 21.06.2019 22:00
Students at a high school were asked about their favorite outdoor activity. the results are shown in the two-way frequency table below. fishing camping canoeing skiing total boys 36 44 13 25 118 girls 34 37 22 20 113 total 70 81 35 45 231 select all the statements that are true based on the given table. more girls chose camping as their favorite outdoor activity than boys. more girls chose canoeing as their favorite outdoor activity than those who chose skiing. more boys chose skiing as their favorite outdoor activity than girls. there were more boys surveyed than girls. twice as many students chose canoeing as their favorite outdoor activity than those who chose fishing. more students chose camping as their favorite outdoor activity than the combined number of students who chose canoeing or skiing.
Answers: 1
You know the right answer?
Questions
Mathematics, 12.08.2020 09:01

Chemistry, 12.08.2020 09:01

English, 12.08.2020 09:01

History, 12.08.2020 09:01

Social Studies, 12.08.2020 09:01
Mathematics, 12.08.2020 09:01

Biology, 12.08.2020 09:01

Medicine, 12.08.2020 09:01
Social Studies, 12.08.2020 09:01
Biology, 12.08.2020 09:01
English, 12.08.2020 09:01


