subject
Mathematics, 13.04.2021 01:10 ohnoitsabby5431

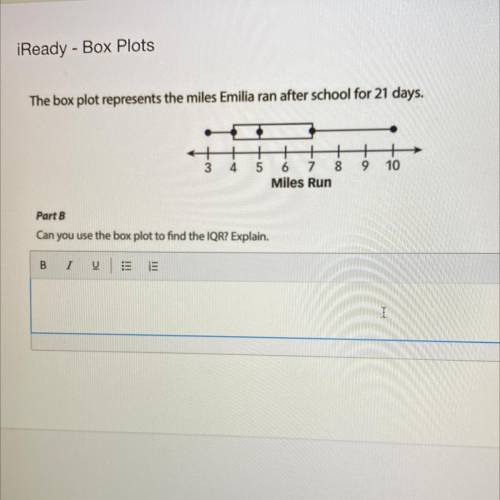
The box plot represents the miles Emilia ran after school for 21 days. 3
4
5
9
10
6 7
8
Miles Run
Part B
Can you use the box plot to find the IQR? Explain.


The box plot represents the miles Emilia ran after school for 21 days.

3
4
5
9
10
6 7
8
Miles Run

ansver
Answers: 2

Another question on Mathematics

question
Mathematics, 21.06.2019 14:00
Suppose a man is heterozygous for heterochromia, an autosomal dominant disorder which causes two different‑colored eyes in an individual, produced 25‑offspring with his normal‑eyed wife. of their children, 15 were heterochromatic and 10 were‑normal. calculate the chi‑square value for this observation.
Answers: 1
question
Mathematics, 21.06.2019 21:00
Asequence has its first term equal to 4, and each term of the sequence is obtained by adding 2 to the previous term. if f(n) represents the nth term of the sequence, which of the following recursive functions best defines this sequence? (1 point) f(1) = 2 and f(n) = f(n − 1) + 4; n > 1 f(1) = 4 and f(n) = f(n − 1) + 2n; n > 1 f(1) = 2 and f(n) = f(n − 1) + 4n; n > 1 f(1) = 4 and f(n) = f(n − 1) + 2; n > 1 i will award !
Answers: 1
question
Mathematics, 21.06.2019 22:00
[tex]5 \times1 \frac{12}{13} [/tex] me
Answers: 1
question
Mathematics, 21.06.2019 23:30
Which statements are true about box plots? check all that apply. they describe sets of data. they include the mean. they show the data split into four parts. they show outliers through really short “whiskers.” each section of a box plot represents 25% of the data.
Answers: 3
You know the right answer?
The box plot represents the miles Emilia ran after school for 21 days. 3
4
5
9
Questions
question
Geography, 12.06.2021 18:30
Questions on the website: 13722360