
Mathematics, 14.04.2021 01:20 rodneydean4515
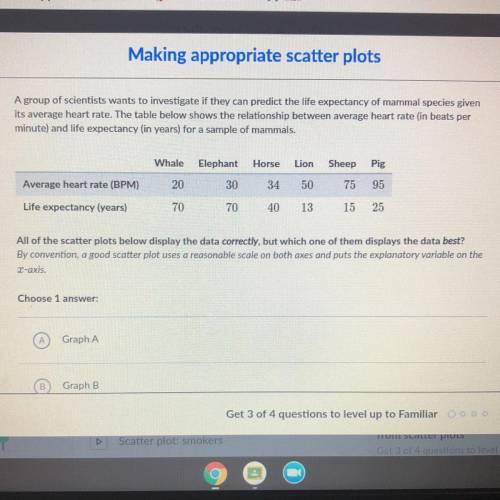
A group of scientists wants to investigate if they can predict the life expectancy of mammal species given
its average heart rate. The table below shows the relationship between average heart rate (in beats per
minute) and life expectancy (in years) for a sample of mammals.
Whale
Elephant
Horse
Lion
Sheep
Pig
Average heart rate (BPM)
20
30
34
50
75
95
Life expectancy (years)
70
70
40
13
15
25
All of the scatter plots below display the data correctly, but which one of them displays the data best?
By convention, a good scatter plot uses a reasonable scale on both axes and puts the explanatory variable on the
x- axis

Answers: 3
Another question on Mathematics
Mathematics, 21.06.2019 16:00
The scale for a map is 20 miles = 1/2 inch. the distance between two towns on the map is 3 3/4 inches. what is the actual distance between these towns? 150 miles 38 miles 75 miles 135 miles
Answers: 3
Mathematics, 21.06.2019 18:00
Write an equation for the function that includes the points (1,4/5) and (2,2/3)
Answers: 1
Mathematics, 21.06.2019 20:30
Arectangle has a width of 5 cm and a length of 10 cm. if the width is increased by 3, how does the perimeter change?
Answers: 1
You know the right answer?
A group of scientists wants to investigate if they can predict the life expectancy of mammal species...
Questions


History, 06.10.2019 18:30


Physics, 06.10.2019 18:30

Social Studies, 06.10.2019 18:30

World Languages, 06.10.2019 18:30
English, 06.10.2019 18:30
History, 06.10.2019 18:30


