
Mathematics, 14.04.2021 03:30 KIAZTUNEZ
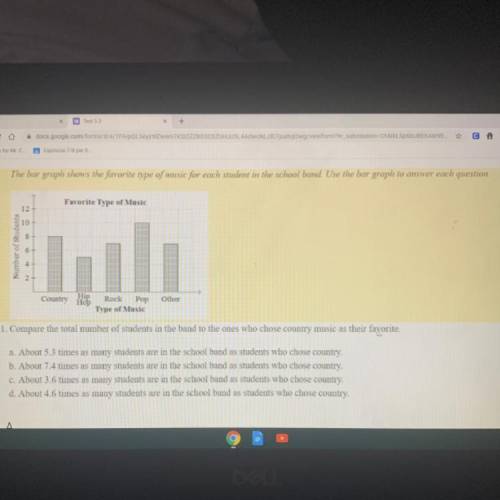
The bar graph shows the favorite type of music for each student in the school band. Use the bar graph to answer each question.
Favorite Type of Music
Number of Students
ul
Other
Country Hop
Rock Pop
Type of Music
11. Compare the total number of students in the band to the ones who chose country music as their favorite.
a. About 5.3 times as many students are in the school band as students who chose country,
b. About 7.4 times as many students are in the school band as students who chose country,
c. About 3.6 times as many students are in the school band as students who chose country.
d. About 4.6 times as many students are in the school band as students who chose country.

Answers: 2
Another question on Mathematics
Mathematics, 21.06.2019 13:30
49xy +34y - 72z. determine the degree of the polynomial
Answers: 1
Mathematics, 21.06.2019 13:50
Asimple random sample of size nequals14 is drawn from a population that is normally distributed. the sample mean is found to be x overbar equals 70 and the sample standard deviation is found to be sequals13. construct a 90% confidence interval about the population mean
Answers: 2
You know the right answer?
The bar graph shows the favorite type of music for each student in the school band. Use the bar grap...
Questions


Mathematics, 05.11.2019 18:31
History, 05.11.2019 18:31
Mathematics, 05.11.2019 18:31
English, 05.11.2019 18:31
Mathematics, 05.11.2019 18:31

Biology, 05.11.2019 18:31
Mathematics, 05.11.2019 18:31


