
Mathematics, 14.04.2021 04:40 amandasantiago2001
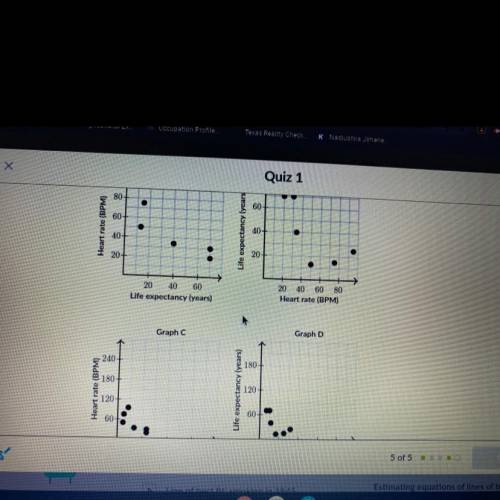
A group of scientists wants to investigate if they can predict the life expectancy of mammal species given
its average heart rate. The table below shows the relationship between average heart rate (in beats per
minute) and life expectancy (in years) for a sample of mammals.
Whale
Horse
Lion
Sheep
Pig
Elephant
30
Average heart rate (BPM)
20
34
50
75
95
Life expectancy (years)
70
70
40
13
15
25
All of the scatter plots below display the dhta correctly, but which one of them displays the data best?
By convention, a good scatter plot uses a reasonable scale on both axes and puts the explanatory variable on the
X-axis.

Answers: 3

Another question on Mathematics
Mathematics, 21.06.2019 17:30
Find the pattern and use it to list the nth term in the sequence. 6, 12, 20, 30, 42, 56, the nth term of the sequence is
Answers: 3
Mathematics, 21.06.2019 21:10
The table below shows the approximate height of an object x seconds after the object was dropped. the function h(x)= -16x^2 +100 models the data in the table. for which value of x would this model make it the least sense to use? a. -2.75 b. 0.25 c. 1.75 d. 2.25
Answers: 2
You know the right answer?
A group of scientists wants to investigate if they can predict the life expectancy of mammal species...
Questions

Computers and Technology, 17.10.2020 07:01


History, 17.10.2020 07:01

Biology, 17.10.2020 07:01
Mathematics, 17.10.2020 07:01


Spanish, 17.10.2020 07:01


