
Mathematics, 14.04.2021 20:10 stressedstudent6402
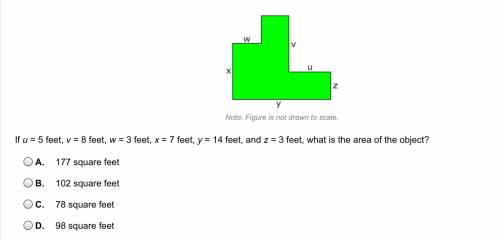
If u = 5 feet, v = 8 feet, w = 3 feet, x = 7 feet, y = 14 feet, and z = 3 feet, what is the area of the object?

Answers: 2
Another question on Mathematics
Mathematics, 21.06.2019 19:00
Find the y-intercept and x-intercept for the equation 5x-3y=60 what is the y-intercept
Answers: 1
Mathematics, 21.06.2019 19:40
Suppose that 3% of all athletes are using the endurance-enhancing hormone epo (you should be able to simply compute the percentage of all athletes that are not using epo). for our purposes, a “positive” test result is one that indicates presence of epo in an athlete’s bloodstream. the probability of a positive result, given the presence of epo is .99. the probability of a negative result, when epo is not present, is .90. what is the probability that a randomly selected athlete tests positive for epo? 0.0297
Answers: 1
Mathematics, 22.06.2019 03:00
Describe how the presence of possible outliers might be identified on the following. (a) histograms gap between the first bar and the rest of bars or between the last bar and the rest of bars large group of bars to the left or right of a gap higher center bar than surrounding bars gap around the center of the histogram higher far left or right bar than surrounding bars (b) dotplots large gap around the center of the data large gap between data on the far left side or the far right side and the rest of the data large groups of data to the left or right of a gap large group of data in the center of the dotplot large group of data on the left or right of the dotplot (c) stem-and-leaf displays several empty stems in the center of the stem-and-leaf display large group of data in stems on one of the far sides of the stem-and-leaf display large group of data near a gap several empty stems after stem including the lowest values or before stem including the highest values large group of data in the center stems (d) box-and-whisker plots data within the fences placed at q1 â’ 1.5(iqr) and at q3 + 1.5(iqr) data beyond the fences placed at q1 â’ 2(iqr) and at q3 + 2(iqr) data within the fences placed at q1 â’ 2(iqr) and at q3 + 2(iqr) data beyond the fences placed at q1 â’ 1.5(iqr) and at q3 + 1.5(iqr) data beyond the fences placed at q1 â’ 1(iqr) and at q3 + 1(iqr)
Answers: 1
Mathematics, 22.06.2019 04:30
Where would an imaginary line need to be drawn to reflect across an axis of symmetry so that a regular pentagon can carry onto itself
Answers: 1
You know the right answer?
If u = 5 feet, v = 8 feet, w = 3 feet, x = 7 feet, y = 14 feet, and z = 3 feet, what is the area of...
Questions
Mathematics, 04.04.2020 03:31


Mathematics, 04.04.2020 03:31

Physics, 04.04.2020 03:31


