
Mathematics, 15.04.2021 18:00 mishcacross21
An event manager recorded the number of people in different age groups that attended a music concert.
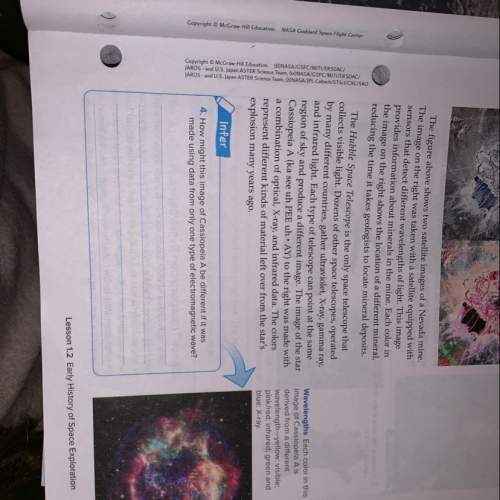
A histogram titled Concert Audience is shown. The horizontal axis is labeled Age Group in years with bins 18 to 24, 25 to 31, 32 to 38, and 39 to 45. The vertical axis labeled Number of People with values from 0 to 120 at intervals of 20. The first bin goes to 20, the second goes to 40, the third goes to 120, and the last goes to 80.
Which data table accurately represents the data in the histogram? (5 points)
Age Group Number of People
18−24 80
25−31 120
32−38 40
39−45 20
Age Group Number of People
18−24 20
25−31 60
32−38 180
39−45 260
Age Group Number of People
18−24 260
25−31 180
32−38 60
39−45 20
Age Group Number of People
18−24 20
25−31 40
32−38 120
39−45 80

Answers: 1

Another question on Mathematics
Mathematics, 21.06.2019 15:30
Mary used 1/7 of a spool of ribbon to complete 4 projects. she used the same amount of ribbon on each project. how much ribbon did she use on each project?
Answers: 2
Mathematics, 21.06.2019 17:30
If the speed of an electromagnetic wave is 100,000 cm/s and its wavelength is 100 cm, what is its frequency? a) 100,000 cycles per second (hz) b) 1 × 10⁻³ cycles per second (hz) c) 10,000,000 cycles per second (hz) d) 1,000 cycles per second (hz)
Answers: 1
You know the right answer?
An event manager recorded the number of people in different age groups that attended a music concert...
Questions

Social Studies, 18.03.2021 02:10
Mathematics, 18.03.2021 02:10

English, 18.03.2021 02:10


Mathematics, 18.03.2021 02:10

Chemistry, 18.03.2021 02:10
Mathematics, 18.03.2021 02:10
History, 18.03.2021 02:10
Mathematics, 18.03.2021 02:10


