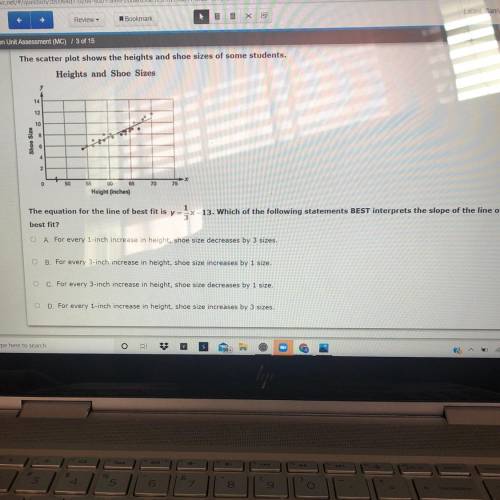
The scatter plot shows the heights and shoe sizes of some students,
Heights and Shoe Slues
14...

Mathematics, 15.04.2021 18:20 kholman
The scatter plot shows the heights and shoe sizes of some students,
Heights and Shoe Slues
14
12
10
TO
76
Height (inches)
The equation for the line of best fitis y *-13. Which of the following statements BEST interprets the slope of the line of
best fit?
A. For every 1-inch increase in height, shoe size decreases by 3 sizes.
OB For every 3 inch increase in height, shoe size increases by 1 size.
OC For every 3-inch increase in height, shoe size decreases by 1 size.
D. For every 1-inch increase in height, shoe size increases by 3 sizes.

Answers: 3
Another question on Mathematics
Mathematics, 21.06.2019 16:20
Two lines parallel to the same plane are parallel to eachother
Answers: 1
Mathematics, 21.06.2019 17:50
Which of these triangle pairs can be mapped to each other using two reflections?
Answers: 1
Mathematics, 21.06.2019 18:30
How do you solving the solution of each system using elimination?
Answers: 2
Mathematics, 21.06.2019 18:30
Anew shopping mall is gaining in popularity. every day since it opened, the number of shoppers is 5% more than the number of shoppers the day before. the total number of shoppers over the first 10 days is 1258 how many shoppers were on the first day?
Answers: 2
You know the right answer?
Questions
Mathematics, 27.02.2020 06:22
Mathematics, 27.02.2020 06:22
Mathematics, 27.02.2020 06:22
Mathematics, 27.02.2020 06:22

Mathematics, 27.02.2020 06:23
Mathematics, 27.02.2020 06:23
Mathematics, 27.02.2020 06:23
Mathematics, 27.02.2020 06:23

Advanced Placement (AP), 27.02.2020 06:23
Mathematics, 27.02.2020 06:23


